The NMDA receptor regulates integrin activation, ATP release and arterial thrombosis through store-operated Ca2+ ... - Frontiers
1. Introduction
Platelets are anuclear cells with a crucial role in hemostasis and thrombosis. Platelet activation and aggregation is important to stop bleeding following vessel injury, but can also trigger pathological thrombus formation to provoke thrombosis. Consequently, platelets play a dominant role in cardiovascular diseases including myocardial infarction, stroke or abdominal aortic aneurysm (1–6). Cytosolic calcium is a second messenger important for many (patho-) physiological processes in platelets (7), including integrin activation, cytoskeletal reorganization, degranulation, pro-coagulant activity and thrombus formation (8–11). Ca2+ signaling is activated through activation of GPVI, thrombin receptors and purinergic receptors including P2Y1, P2Y12 and P2X1 at the platelet membrane leading to intracellular signaling cascades including the phosphorylation of PLC (8, 12). A variety of hormones and growth factors stimulate the hydrolysis of phosphatidylinositol 4, 5-bisphosphate (PIP2) by PLC, thereby producing two different messengers: Diacylglycerol (DAG) and inositol 1,4,5-trisphosphate (IP3) (13). IP3 binds and activates its receptor (IP3R), which is localized in the dense tubular system (DTS) membrane (14). Subsequently, Ca2+ is released from the DTS, resulting in a transient depletion of intraluminal Ca2+. Decreased Ca2+ levels activate stromal interaction molecule 1 (STIM1) at the DTS membrane. This induces STIM1 oligomer aggregation and its translocation to the plasma membrane (15). At this site, STIM1 binds to ORAI1 resulting in its activation. The activation of ORAI1 induces shape changes, which allows Ca2+ to pass into the cytosol, which stimulates the process termed as store-operated-Ca2+-entry (SOCE) and increases the intracellular Ca2+ level ([Ca2+](i)) in platelets. The increase activates multiple Ca2+-dependent targets. The increased Ca2+ level in the cell is also used as a Ca2+ source to replenish the intraluminal Ca2+ level in the DTS, for which the sarco (endo) plasmic reticulum calcium-ATPase 2 (SERCA2) is responsible (11). Transient receptor potential (TRP) proteins form a superfamily of cation channels that are expressed in platelets and many other cell types. Beside ORAI1 and STIM1, TRP channels regulate Ca2+ entry and [Ca2+](i) dynamics through different mechanisms including membrane depolarization or store- and receptor-operated mechanisms (16).
In recent years, N-methyl-D-aspartate receptors (NMDARs) were identified to contribute to Ca2+ signaling in platelets. NMDARs belong to the family of ionotropic glutamate receptors (iGluRs). They assemble from tetrameric combinations of GluN1, GluN2, and GluN3 subunits, with GluN1 being obligatory for channel function. Distinct from other iGluR subfamilies, most NMDARs show relevant Ca2+ permeability and exhibit a voltage-dependent block by extracellular Mg2+ ions. Activation of most NMDAR subunit combinations requires binding of the agonist glutamate to GluN2 and the co-agonists glycine or D-serine to GluN1 subunits. An exception form complexes from GluN1 and GluN3, lacking a glutamate-binding site, which serve as glycine-activated cation channels (17–20). NMDARs are particularly known for their role in the brain and serve as signaling pathway for glutamate-mediated intercellular communication. However, NMDARs are also active in non-neuronal cells (21) playing an important role in proliferation, cell growth and differentiation (22), actin rearrangement (23) cell adhesion and migration (24) as well as in regulation of hormone secretion (25). Moreover, the NMDAR is expressed in the heart and in the vasculature and NMDAR signaling might contribute to acute cardiovascular effects of ethanol (26). NMDARs are also involved in platelet function and pro-platelet formation (27, 28). However, the precise role of NMDARs in platelets and the contribution of NMDAR signaling to thrombosis is not well-defined to date. Therefore, we have analyzed platelet-specific NMDAR deficient mice (Grin1fl/fl-Pf4-Cre+) to identify NMDAR mediated activation and Ca2+ signaling in platelets important for hemostasis and thrombosis in vitro and in vivo.
2. Materials and methods
2.1. Chemicals and antibodies
For platelet isolation apyrase (Grade II from potato, #A7646, Sigma-Aldrich) and prostacyclin (#P5515, Calbiochem,) were used. Platelets were activated with collagen-related peptide (CRP; Richard Farndale, University of Cambridge, Cambridge, UK), adenosine diphosphate (ADP; #A2754, Sigma-Aldrich), the thromboxane A2 analogue U46619 (U46; #1932, Tocris), PAR4 peptide (PAR4; St. Louis, Missouri, MO, USA), thrombin (Thr; #10602400001, Roche Diagnostics, Germany), lipopolysaccharide (LPS, #L4524, Sigma-Aldrich) or convulxin (CVX, ALX-350-100-C050, ENZO Life Sciences). For immunoblotting antibodies targeting total Src (#2109, Cell Signaling, 1:1,000) and phosphorylated Src (#59548, Cell Signaling, 1:1,000), total Syk (#2712, Cell Signaling, 1:1,000), and phosphorylated Syk (#2710, Cell Signaling, 1:1,000), total Pannexin-1 (Panx1, #91137S, Cell Signaling, 1:1,000) and phosphorylated Panx1 (pPanx1 Tyr198, #ABN1681, Merck, 1:1,000), total Akt (Cell Signaling, #9272S) and phosphorylated Akt (pAkt Ser473, Cell Signaling, #9271S), β-Actin (Cell Signaling, #4967), glyceraldehyde 3-phosphate dehydrogenase (GAPDH, #2118S, Cell Signaling, 1:1,000), phospho-PKC substrate motif [(R/K)XpSX(R/K)] (Cell Signaling, #6967), and horseradish peroxidase (HRP)-linked anti-rabbit secondary antibodies (#7074S, Cell Signaling, 1:2,500) were used. Additionally and anti GLUN1-Antibody (#5704, Cell Signaling; 1:500) was used for detection of Grin1 expression in platelets. For flow cytometric analysis fluorophore conjugated antibodies labelling P-selectin (murine: CD62P, Wug.E9-FITC, #D200, Emfret Analytics; human: PE mouse anti-human P-Selectin, BD Biosciences), active integrin αIIbβ3 (murine: JON/A-PE, #D200; Emfret Analytics; human: FITC mouse anti-human PAC-1; BD Biosciences), GPIbα (CD42b, Xia.G5-PE, #M040-2 Emfret Analytics), GPVI (JAQ1-FITC, #M011-1, Emfret Analytics), integrin α5 (CD49e, Tap.A12-FITC, # M080-1, Emfret Analytics) and integrin β3 (CD61, Luc.H11-FITC, #M031-1, Emfret Analytics) were used. For inhibition experiments with human platelets, the inhibitor MK-801 (M107; Sigma-Aldrich) was used in indicated concentrations.
2.2. Human blood samples and ethic votes
Fresh citrate-anticoagulated blood (BD-Vacutainer®; Becton, Dickinson and Company; #367714) was collected from healthy volunteers. All healthy volunteers provided their written informed consent to participate in this study according to the Ethics Committee of the University Clinic of Duesseldorf, Germany (2018-140-kFogU, study number: 2018064710). This study was conducted according to the Declaration of Helsinki and the International Council for Harmonization Guidelines on Good Clinical Practice.
2.3. Human platelet isolation
For human platelet isolation, citrate-anticoagulated whole blood was centrifuged at 200×g for 10 min at RT and slowly decelerated. Subsequently, the upper phase, platelet-rich plasma (PRP) was collected and transferred into 1 ml PBS (pH 6.5). Platelet activation was inhibited by the addition of 2.5 U/ml apyrase and 1 µM prostaglandin E1 (PGE1). After centrifugation at 1,000×g for 6 min the supernatant was discarded and the platelet pellet was dissolved in human Tyrode's buffer (pH 7.4; 140 mM NaCl2, 2.8 mM KCl, 12 mM NaHCO3, 0.5 mM Na2HPO4, 5.5 mM glucose). For cell count determination, a 1:10 dilution in Tyrode's buffer was measured using a hematology analyzer (Sysmex—KX21N; Nordstedt, Germany). Cell count was set according to the experimental design by diluting with human Tyrode's buffer. MK-801 was preincubated for 15 min at 37°C for determination of altered platelet activation.
2.4. Animals
Pathogen-free Grin1fl/fl (B6.129S4-Grin1tmStl/J) mice were provided by Dr. Eckhardt Lammert and cross-bread with PF4-Cre mice that were purchased from the Jackson Laboratory [C57BL/6-Tg (Pf4-cre) Q3Rsko/J], to generate megakaryocyte/platelet specific deletion of Grin1. The Grin1fl/fl-Pf4-Cre+ and Grin1fl/fl-Pf4-Cre− mice were already described and characterized by Hearn and colleagues (28).
In vivo thrombus formation assays and tail bleeding time were performed only in male mice aged 10–12 weeks (3–4 weeks for model of mesenteric arteries). All other experiments were conducted with male and female mice with an age of 2–4 months. Mice were maintained in an environmentally controlled room at 22 ± 1°C with a 12 h day-night cycle. Mice were housed in Macrolon cages type III with ad libitum access to food (standard chow diet) and water. All animal procedures were conducted according to the Declaration of Helsinki and are conform to the guidelines from Directive 2010/63/EU of the European Parliament on the protection of animals used for scientific purposes. All animal experiments were approved by the Ethics Committee of the State Ministry of Agriculture, Nutrition and Forestry State of North Rhine-Westphalia, Germany (Reference number: AZ 81-02.05.40.21.041; AZ 81-02.04.2021.A329).
2.5. Tail bleeding time
10 to 12-week-old mice were anesthetized by a singular intraperitoneal (i.p.) injection of Ketamine (100 mg/kg body weight, Ketaset®, company: Zoetis, Malakoff, France) and Xylazine (10 mg/kg body weight, Xylazin, company: WDT, Ulft, Netherlands). After progressing successfully anesthesia, the tail tip was cut with a scalpel at a position where the diameter of the tail is 2.25 – 2.5 mm using a gauge. The tail was immersed in normal saline (37°C). The time from the incision to the cessation of bleeding was recorded (no blood flow for 1 min) as described previously (30). Euthanasia was performed by cervical dislocation.
2.6. Mouse model of arterial injury of mesenteric arterioles
Mice (3–4 weeks of age) were anesthetized by a singular intraperitoneal (i.p.) injection of Ketamine (100 mg/kg body weight, Ketaset®, company: Zoetis, Malakoff, France) and Xylazine (10 mg/kg body weight, Xylazin, company: WDT, Ulft, Netherlands). After progressing successfully anesthesia, a midline abdominal incision was done, the mesentery was exteriorized and arterioles free of fat tissue were injured by topical application of a filter paper saturated with 20% FeCl3 for 20 s. Thrombus formation was observed with a fluorescence microscope (40×, Zeiss, Axio Observer, Germany). Time until full occlusion of the vessel (when blood flow had stopped for more than 60 s) was measured. After 40 min without vessel occlusion, experiments were terminated. Euthanasia was performed by cervical dislocation.
2.7. Mouse model of arterial injury of the A. carotis communis
10 to 12-week-old mice were anesthetized by intraperitoneal administration of Ketamine and Xylazine as described above and the right A. carotis communis was prepared and placed into a flow probe (Transonic Systems, 0.5 PSB, AD Instruments). Before starting the measurement, the artery and the surrounding area were moisturized with 0.9% NaCl2 and blood flow was measured in ml/min. Then a small pad was placed under the artery below the measuring head and the environment of the artery was dried. A 0.5 × 1 mm filter paper (Whatmann No.1) saturated with 10% FeCl3 (Sigma-Aldrich) was placed at the area of the carotid artery below the measuring head for 3 min. After removing the filter paper, the environment of the artery was moisturized with 0.9% NaCl2 again. The formation of the thrombus and or occlusion of the artery was recorded by the software until 5 min after a firm occlusion (stopped blood flow) or if there is no occlusion until the measurement reached a duration of 30 min. Euthanasia was performed by cervical dislocation.
2.8. Murine blood collection and platelet isolation
Mice were placed for anesthesia with controlled supply of isoflurane (2%) and oxygen (1 L/min). The blood was collected by using glass capillaries covered with sodium heparin by puncturing the retrobulbar venous plexus. Murine platelet isolation was conducted as described elsewhere (29). Briefly, murine heparinized blood was centrifuged for 5 min at 250×g (at RT). The upper phase was collected into a new reaction tube and an additional centrifugation step at 50×g for 5 min at RT followed to prevent contamination of other blood cells. The PRP was collected in a fresh tube with the addition of apyrase (0.02 U/ml) and prostacyclin (0.5 µM; PGI2) to prevent platelet preactivation. PRP was washed two times at 650×g for 5 min with murine Tyrode's buffer [pH 7.35; 136 mM NaCl, 0.4 mM Na2HPO4, 2.7 mM KCl, 12 mM NaHCO3, 0.1% glucose, 0.35% bovine serum albumin (BSA)], containing apyrase and PGI2. Cell count was determined in a 1:10 dilution at using a hematology analyzer. For experimental use, the isolated platelets were resuspended in Tyrode's buffer supplemented with 1 mM CaCl2 (in absence of apyrase, PGI2 and BSA).
2.9. Immunoblotting
Murine platelets were isolated as described in 2.8. Isolated platelets (40 × 106) were stimulated with CRP or thrombin for indicated time-points at 37°C for time dependent analysis. For concentration dependent analysis, CRP stimulation was terminated after 2 min, and PAR4 stimulation after 5 min. Platelet stimulation was terminated by adding 1× human lysis buffer (100 mM Tris-HCl, 725 mM NaCl2, 20 mM EDTA, 5% TritonX-100, complete protease inhibitor). Lysis was performed for 15 min at 4°C. Afterwards, 6× Laemmli buffer was added to the platelet lysates, followed by a denaturation step at 95°C for 5 min. The platelet lysates were stored at −70°C until use. For immunoblotting platelet lysates were separated by sodium dodecyl sulfate polyacrylamide gel electrophoresis (SDS-PAGE; 10% acrylamide). After gel separation using SDS-PAGE running buffer [pH 8.3; 25 mM Tris base, 192 mM glycine, and 0.1% (w/v) SDS] for 2.5 h (25 mA), the gels were blotted to a nitrocellulose membrane for 1 h (70 mA). Unspecific antibody binding was prevented by blocking the membranes in 5% non-fat dry milk in TBST (Tris-buffered saline containing 0.1% Tween20) for 1 h at RT. After 3× times washing n TBST the membrane was probed with specific antibody's listed under 2.1 at 4°C overnight. After washing, the membranes were probed with HRP-conjugated secondary antibody (#7074S, Cell Signaling, 1:2,500) for 1 h at RT. GAPDH (#2118S, Cell Signaling, 1:1,000) served as loading control. Bands were visualized by chemiluminescence detection reagents (BioRad, #1705061) and imaged using a FusionFX Chemiluminescence Imager System (Vilber). Quantification of immune-reactive band intensities was performed by using Image J sofware.
2.10. Determination of ATP release by enzyme-linked immunosorbent assay (ELISA)
Human and murine platelets were isolated and activated with CRP or thrombin as described above and fixed for 2 h at 4°C using 2% Paraformaldehyde. The platelets were centrifuged at 650×g and releasates were collected and stored at −70°C before use. ATP levels were quantified using the bioluminescence assay kit from Roche Diagnostics following the manufacturer's protocol.
2.11. Flow cytometry
Flow cytometry was performed as described elsewhere (30). Briefly, heparinized murine whole blood was washed three times with murine Tyrode's buffer by centrifugation at 650×g for 5 min. After washing the whole blood samples were diluted in murine Tyrode's buffer containing 1 mM CaCl2. Citrate-anticoagulated human blood samples were diluted in a 1:10 ratio with human Tyrode's buffer. For the analysis of platelet activation, samples were stimulated with indicated agonists and specifically labeled with antibodies against P-selectin and active integrin αIIbβ3 (JON/A) in a ratio of 1:10 for 15 min at 37°C. Reaction was stopped by adding 300 µl of PBS to all samples. To analyze glycoprotein (GP) expression, washed whole blood was labeled for GPIbα, GPVI, integrin α5, or integrin β3 in a ratio of 1:10 for 15 min at RT. In All samples the MFI (mean fluorescence intensity) of the platelet specific FSC/SSC population was analyzed using a FACSCalibur flow cytometer (BD Biosciences).
2.12. Determination of intracellular calcium mobilization
Murine and human platelets were isolated as described above and resuspended in respective Tyrode's buffer without Ca2+ and loaded with 5 µM Fura-2 acetoxymethyl ester (#65-0858-39; Invitrogen) and 0.2 µg/ml of Pluronic F-127 (P2443; Biotium) at 37°C for 20 min. Platelets were washed once and resuspended in Tyrode's buffer containing 0.5 mM EGTA (#3054; Roth) for determination of store release measurements. For detection of store operated calcium entry (SOCE) buffer containing 1 mM Ca2+ was used. After platelet activation with different agonists and co-incubation with MK-801 for human platelets, the Ca2+ response was measured under stirring conditions. A spectrofluorometer (FL 6500; PerkinElmer) at alternate excitation wavelengths of 340 and 380 nm was used. The ratio values of 340/380 nm were converted into Ca2+ concentrations (Ca2+) by lysis of platelets with Triton X-100 (T8787; Sigma-Aldrich) for detection of the maximum ratio value. Followed by adding of EGTA to determine a minimum ratio value. Measurements with thapsigargin (TG; T7458; Invitrogen) were performed in Ca2+-free Tyrode's buffer. Incubation of platelets with 5 µM TG was followed by the addition of 1 mM Ca2+ to measure Ca2+ influx in murine and human platelets.
2.13. Platelet aggregation and ATP release
Freshly isolated platelets from healthy volunteers were measured as percentage light transmission compared to human Tyrode's buffer (as = 100%) using Chrono-Log dual channel lumi-aggregometer (model 700) at 37°C stirring at 1,000 rpm. Agonists were used as indicated and human platelets were pre-incubated with MK-801 for 15 min at 37°C before measurement.
ATP release from human platelets was assessed applying a luciferin/luciferase bioluminescent assay and calculated using a provided ATP standard protocol (all Chrono-Log).
2.14. Thrombus formation under flow: flow chamber experiments
Cover slips (24 × 60 mm) were coated with 200 µg/ml fibrillary type I collagen (Nycomed) and blocked with 1% BSA. Subsequently, heparinized murine or citrate-anticoagulated human whole blood was filled in a 1 ml syringe and perfused over a collagen-coated surface at shear rate of 450, 700, 1,000 and 1,700 s−1 and platelet adhesion and aggregate formation was evaluated from five different microscopic areas (LD Plan-Neofluar x 40, Axio Observer D1; Carl Zeiss) using Image J Software.
2.15. Statistical analysis
Data are presented as arithmetic means ± SEM (Standard error of mean), statistical analysis was performed using GraphPad Prism 8 (version 8.4.3). Statistical differences were determined using a two-way or one-way ANOVA with a Sidak's multiple comparison post-hoc test, an unpaired multiple t-test or an unpaired student's t-test. Significant differences are indicated by asterisks (***P < 0.001; **P < 0.01; *P < 0.05).
3. Results
3.1. NMDAR in platelets contributes to store-operated Ca2+ entry (SOCE) but not to store release following platelet activation
The absence of the GluN1 subunit of the NMDAR on platelets isolated from Grin1fl/fl-Pf4-Cre+ mice was confirmed (Supplementary Figure S1A). The number of red blood cells (RBCs) (Supplementary Figure S1B) and white blood cells (WBCs) (Supplementary Figure S1C) were unaltered in Grin1fl/fl-Pf4-Cre+ mice compared to controls (Grin1fl/fl-Pf4-Cre− mice). In contrast to Hearn et al., we detected reduced platelet counts only by trend (Supplementary Figure S1D) while the mean platelet volume (Supplementary Figure S1E) was unaltered between groups. The exposure of different receptors at the platelet membrane including glycoproteins and integrins were unaltered in Grin1fl/fl-Pf4-Cre+ mice compared to controls (Grin1fl/fl-Pf4-Cre− mice) (Supplementary Figure S1F).
In a first step, we analyzed Ca2+ mobilization upon platelet activation using platelets from Grin1fl/fl-Pf4-Cre+ and Grin1fl/fl-Pf4-Cre− mice because the NMDAR forms an ion channel pore that is selective for cations, in particular for Ca2+ and channel opening is induced by NMDAR activation. Baseline levels of [Ca2+](i) were unaltered in Grin1fl/fl-Pf4-Cre+compared to controls (Grin1fl/fl-Pf4-Cre−) (Figures 1A,B). Subsequent activation of platelets with thrombin resulted in intracellular Ca2+ mobilization in platelets. However, in the presence of extracellular Ca2+, the increase in intracellular Ca2+ [(Ca2+)i] was significantly reduced after stimulation of platelets with high doses of thrombin while no alterations have been detected in the absence of extracellular Ca2+ (i.e., in the presence of EDTA) (Figures 1C,D). Stimulation of platelets with CRP resulted in an increase in [Ca2+](i) in both, platelets from Grin1fl/fl-Pf4-Cre+ and Grin1fl/fl-Pf4-Cre−mice. However, the increase of [Ca2+](i) was significantly reduced after stimulation of platelets with high doses of CRP in the presence of extracellular Ca2+ while no differences were detected in the absence of extracellular Ca2+ (i.e., in the presence of EDTA) (Figures 1E,F). Measurements of agonist-induced changes in [Ca2+]i revealed a clear reduction of store-operated Ca2+ entry (SOCE) but not of store release. These defects in extracellular Ca2+ mobilization in NMDAR deficient platelets suggested a general defect in Ca2+ homeostasis induced by NMDAR deficiency.
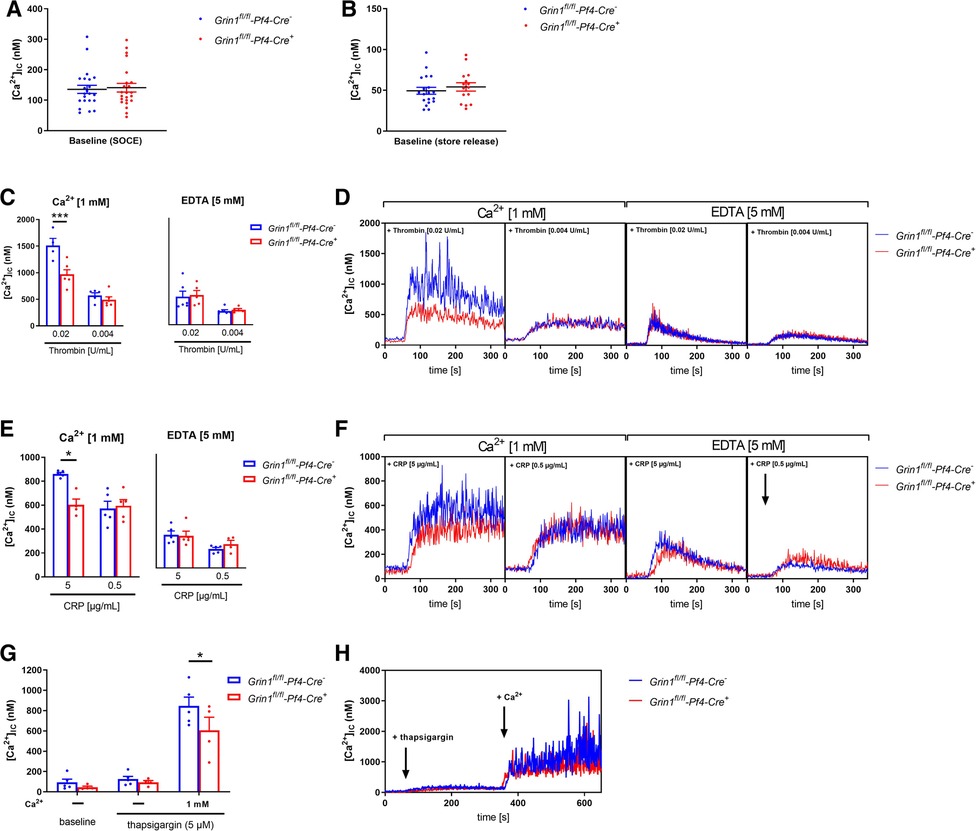
Figure 1. NMDAR regulates store operated calcium entry (SOCE) in murine platelets. (A) Determination of intracellular Ca2+ concentration [(Ca2+)IC] of platelets in buffer containing 1 mM Ca2+ for SOCE measurement (n = 22–23). (B) Determination of [Ca2+]IC of platelets in buffer containing 5 mM EGTA for store-release measurement (n = 16–20). (C) Determination of SOCE and store-release in NMDAR deficient platelets after stimulation with thrombin compared to respective WT control platelets (n = 5–6). (D) Representative measurements of [Ca2+]IC in the spectral fluorimeter after thrombin stimulation. (E) Determination of SOCE and store-release in Grin1fl/fl-Pf4-Cre+platelets after stimulation with collagen-related peptide (CRP) compared to respective WT control platelets (n = 5). (F) Representative measurements of [Ca2+]IC in the spectral fluorimeter after CRP stimulation. (G) Determination of the [Ca2+]IC using a sarcoplasmic/endoplasmic reticulum Ca2+-ATPases (SERCA-2) inhibitor thapsigargin following Ca2+ administration (n = 4–5). (H) Representative measurements of intracellular Ca2+ flux in the spectral fluorimeter after SERCA-2 inhibition via thapsigargin and Ca2+ exposure. Depicted are mean values + s.e.m.; *P < 0.05, ***P < 0.001 using two-way ANOVA followed by Sidak's multiple comparison test.
To test this hypothesis, we treated Fura-2–loaded platelets with the SERCA inhibitor thapsigargin (TG). Again, no differences in [Ca2+]i were detected at baseline (Figures 1G,H). In the absence of extracellular Ca2+, TG (5 µM) triggered a Ca2+ release from intracellular stores that was unaltered between platelets of both groups. However, the addition of extracellular Ca2+ induced SOCE that was significantly reduced in platelets from Grin1fl/fl-Pf4-Cre+ compared to controls (Grin1fl/fl-Pf4-Cre−) (Figures 1G,H). Taken together, these results demonstrate that the NMDAR is involved in SOCE but not in store release, indicating a role for the NMDAR as a powerful Ca2+ regulator for extracellular Ca2+ mobilization in platelets.
3.2. NMDAR is important for integrin αIIbβ3 activation and ATP release of platelets
Next, we analyzed platelet activation after stimulation of platelets with standard agonists. As shown in Figure 2A, the activation of integrin αIIbβ3 (fibrinogen receptor) was reduced after stimulation of platelets with ADP and U46619 (thromboxane analogue), the snake venom convulxin (CVX), PAR4 peptide and thrombin (Figure 2A). This might be due at least in part by reduced agonist-stimulated up-regulation of integrin αIIbβ3 at the platelet membrane (Figure 2B). In contrast, P-selectin exposure was not affected in GRIN1 deficient platelets compared to wildtype controls (Grin1fl/fl-Pf4-Cre−) (Figure 2C). However, we detected reduced dense granule release as detected by levels of ATP following platelet activation (Figure 2D). These results suggest that the NMDAR in platelets is important for the activation of integrin αIIbβ3 and the release of ATP from dense granules.
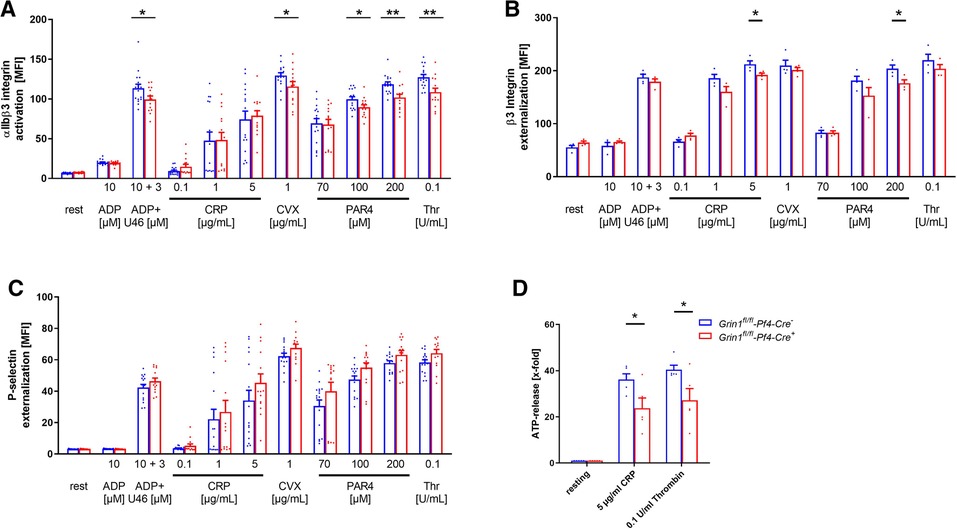
Figure 2. Loss of functional NMDAR leads to reduced αIIbβ3 integrin activation and ATP release of platelets. (A) Activation of αIIbβ3 integrin on the platelet surface with indicated agonists (n = 16). (B) Externalization upon platelet stimulation of the β3 Integrin subunit (n = 4). (C) Externalization of P-selectin on the platelet surface with indicated agonists (n = 16). (D) ATP-release measured in platelet releasates after activation with indicated agonists (n = 5). Depicted are mean values + s.e.m.; *P < 0.05, **P < 0.01 using unpaired students t-test. CVX, convulxin; CRP, collagen related peptide; U46, U46689 (Thromboxane A2 analog); Thr, thrombin; rest, resting state; PAR4, PAR4 activating peptide; ADP, adenosine-diphosphate.
3.3. Genetic deletion of NMDAR leads to reduced phosphorylation of Src and protein kinase (PK)C substrates in platelets
Src family kinases (SFKs) are key regulators of NMDAR function and major points of convergence for neuronal transduction pathways (31, 32). To investigate if Src activation plays a role in NMDAR function in platelets as well, we performed Western blot analysis and analyzed the phosphorylation of Src at Tyr416. As shown in Figure 3A–D, we found delayed Src phosphorylation at Tyr416 in response to CRP or PAR4 peptide because full Src activation was detected after 90 s in control (Grin1fl/fl-Pf4-Cre−) and after 120 s in Grin1fl/fl-Pf4-Cre+ platelets (Figures 3A–D). Furthermore, we analyzed PKC substrate serine phosphorylation after stimulation of platelets with PAR4 peptide and CRP, respectively. We detected reduced serine phosphorylation of PKC substrates with a size of 100 kDa following PAR4 peptide stimulation and with a size of 75 kDa following CRP stimulation of platelets (Figures 3E–J). However, no differences in serine phosphorylation of PKC substrates with a size of 40 kDa were found after platelet activation (Supplementary Figures S2A,B). Only resting platelets from Grin1 deficient mice showed reduced phosphorylation of PKC substrates with a size of 40 kDa (Supplementary Figure S2A). In the central nervous system, it is well known that one target of the NMDAR is pannexin-1 (Panx1). Therefore, we analyzed the phosphorylation of Panx1 as marker for Panx1 activation. Platelets were stimulated with CRP or PAR4 peptide using low and high doses of the agonist and analyzed by Western blot to determine the phosphorylation of Panx1 at Tyr198 known as marker for Panx1 activation (33). As shown in Supplementary Figure S2, no differences in Panx1 activation between platelets from Grin1fl/fl-Pf4-Cre+ and Grin1fl/fl-Pf4-Cre− mice were observed following stimulation of platelets with CRP or PAR4 peptide (Supplementary Figures S2C,D). We next investigated the activation of Syk. As shown in Supplementary Figure S2, the phosphorylation of Syk was unaltered in platelets from Grin1fl/fl-Pf4-Cre+ mice compared to controls (Grin1fl/fl-Pf4-Cre−) (Supplementary Figures S2E–H). Furthermore, the phosphorylation of Akt was unaltered as well as shown in Supplementary Figures S2I–L. Taken together, we provide first evidence that Src and different PKC substrates become phosphorylated/activated following NMDAR activation in platelets as already observed in the central nervous system.
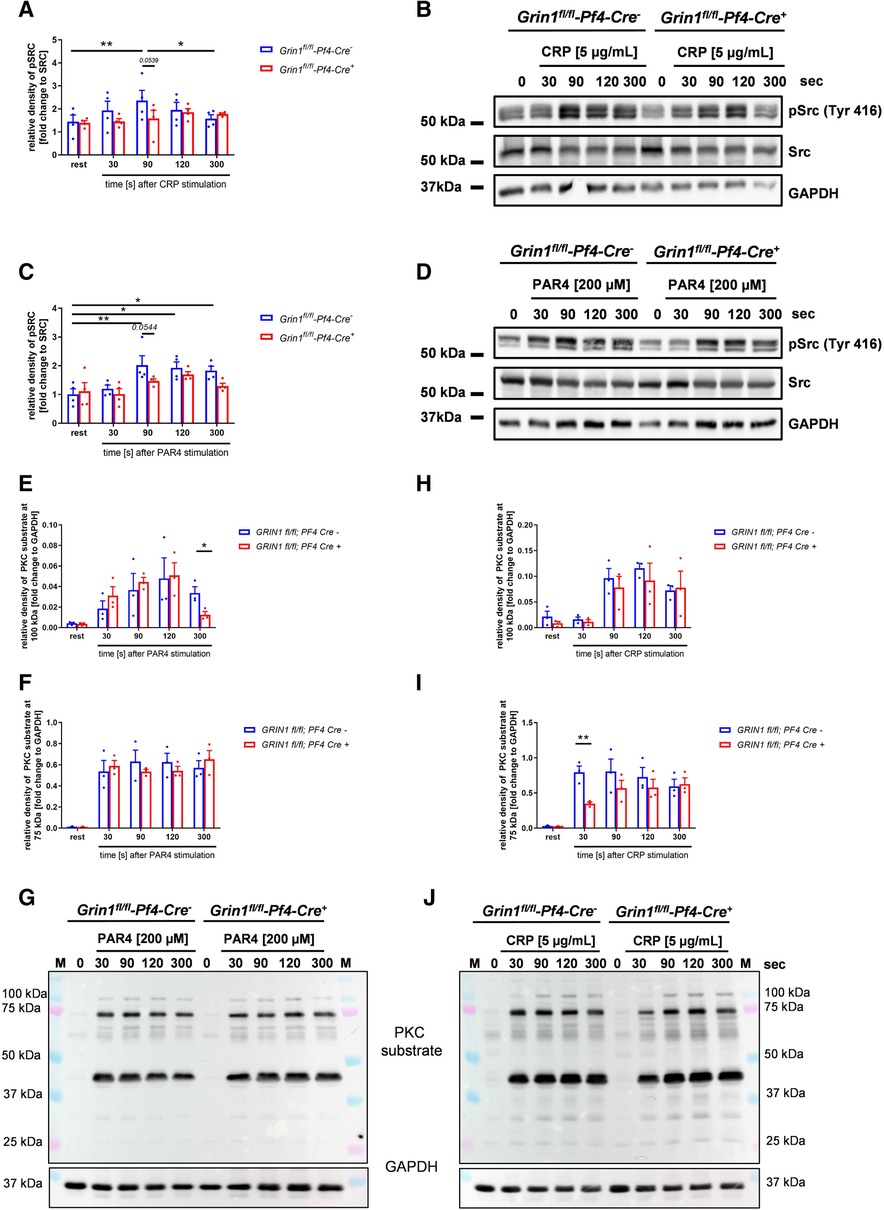
Figure 3. Grin1fl/fl-Pf4-Cre+platelets show attenuated Src and PKC substrate phosphorylation after stimulation. (A) Time dependent analysis of Src phosphorylation (Tyr416) after stimulation with collagen related peptide (CRP) of NMDAR deficient platelets (with (B) respective WT controls and representative blots (n = 4). (C) Time dependent analysis of Src phosphorylation (Tyr416) after stimulation with PAR4 activating peptide (PAR4) of NMDAR deficient platelets with (D) respective WT controls and representative blots (n = 5). (E-G) Time dependent analysis of PKC substrate phosphorylation after stimulation of platelets with collagen related peptide (CRP). Analysis of PKC substrate phosphorylation for (E) the 100 kDa signal, (F) the 75 kDa signal with (G) representative blots (n = 3). (H–J) Time dependent analysis of PKC substrate phosphorylation after stimulation of platelets with collagen related peptide (CRP). Analysis of PKC substrate phosphorylation for (H) the 100 kDa signal, (I) the 75 kDa signal with (J) representative blots (n = 3, GAPDH served as loading control). Depicted are mean values + s.e.m.; *P < 0.05, **P < 0.01 using two-way ANOVA followed by Sidak's multiple comparison test for time dependent comparison and unpaired students t-test for comparison at same stimulation time point.
3.4. Decreased Ca2+ mobilization and integrin activation results in reduced thrombus formation under flow conditions ex vivo
To analyze the consequences of NMDAR deficiency in platelets under more physiological conditions, we performed flow chamber experiments. To this end, we perfused whole blood of Grin1fl/fl-Pf4-Cre+ and Grin1fl/fl-Pf4-Cre− mice over a collagen coated surface at different shear rates using a pulse-free pump. As shown in Figure 4, the deficiency of NMDAR in platelets resulted in reduced thrombus formation under flow conditions (Figures 4A,B). Significantly reduced surface coverage of three-dimensional thrombi was observed under a shear rate of 700 s−1 and 1,000 s−1. Reduced thrombus formation using a shear rate of 1,700 s−1 was only detected by trend (Figures 4A,B).
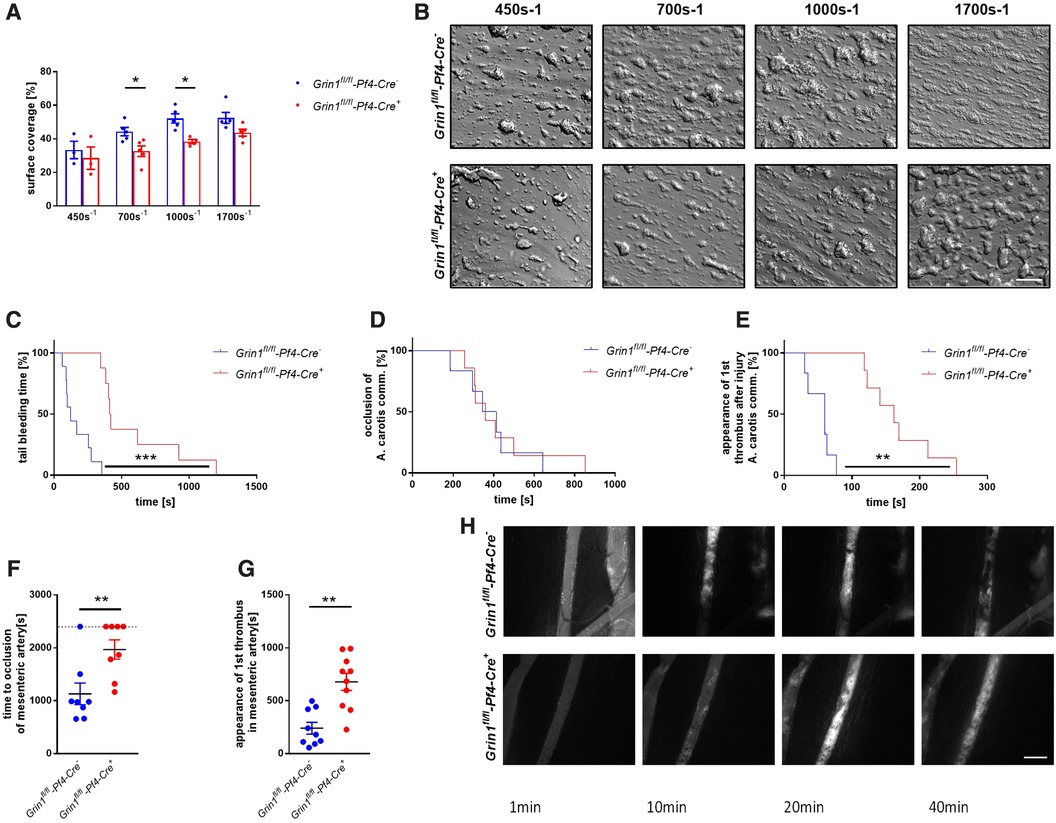
Figure 4. Genetic deletion of GRIN1 in platelets leads to reduced thrombus formation in vivo and prolonged bleeding times. (A) Analysis of thrombus formation at indicated shear rates on a collagen matrix with (B) representative images from platelet specific NMDAR deficient mice (Grin1fl/fl-Pf4-Cre+) and respective controls (Grin1fl/fl-Pf4-Cre−) (n = 3–6). (C) In vivo analysis of hemostatic dysfunction as determined by tail bleeding times (n = 9). (D) In vivo analysis of FeCl3-induced injury of the carotid artery via time to full occlusion of the artery and (E) analysis of beginning of thrombus formation (n = 6–10). (F) In vivo analysis of FeCl3-induced injury of the mesenteric artery via time to full occlusion of the artery and (G) analysis of beginning of thrombus formation (n = 8–9) with (H) representative microscopic images at indicated time points. *P < 0.05, **P < 0.01, ***P < 0.001 using unpaired student's t-Test (A, F and G). For analysis of Kaplan Meyer curves a log-rank test was used (C, D and E). Scale bars 50 µm (B) and 100 µm (H).
3.5. Platelet NMDAR is important for hemostasis and arterial thrombosis
To test, if defective extracellular Ca2+ mobilization and integrin activation in GluN1 deficient platelets affects thrombus formation in vivo, we performed a tail bleeding assay to analyze hemostasis in Grin1fl/fl-Pf4-Cre+ mice. As expected, the time to stop bleeding after cutting the tail tip of mice was enhanced in Grin1fl/fl-Pf4-Cre+ mice compared to controls (Grin1fl/fl-Pf4-Cre−) (Figure 4C). So far, no data exist about the role of platelet NMDAR in arterial thrombosis in vivo. Therefore, we analyzed Grin1fl/fl-Pf4-Cre+ and Grin1fl/fl-Pf4-Cre− mice in two different mouse models of arterial thrombosis. In the first model, we induced the injury of the carotid artery by FeCl3. As shown in Figure 4D, the time to occlusion of the vessel was attenuated in Grin1fl/fl-Pf4-Cre+ mice without reaching statistical significance. In contrast, an enhanced time period in Grin1fl/fl-Pf4-Cre+ mice was detected when the appearance of first thrombi after vessel injury were analyzed (Figure 4E) suggesting attenuated thrombus formation after injury of the carotid artery in Grin1fl/fl-Pf4-Cre+ mice. In a second arterial mouse model, injury of mesenteric arterioles was induced by topical application of FeCl3 (Figures 4F–H). Platelet-specific GluN1 deletion resulted in an enhanced occlusion time of the injured vessel. In addition, the appearance of first thrombi was attenuated. Taken together, these results suggest that platelet-specific deficiency of the GluN1 protects mice against arterial thrombosis but also prolongs bleeding times suggesting a delayed hemostasis in these mice.
3.6. NMDAR blocking in human platelets results in impaired SOCE
In a first translational approach, we isolated platelets from healthy volunteers and blocked the NMDAR through the selective NMDA receptor antagonist MK-801. We incubated human platelets with different concentrations of MK-801 to test, if the inhibitor affects Ca2+ baseline levels in the presence or absence of extracellular Ca2+ (Figures 5A,B). No differences at baseline were observed, neither with 1, 10 or 100 µM MK-801 compared to controls (H2O). Next, we activated human platelets with thrombin or CRP and analyzed intracellular Ca2+ mobilization in platelets. In the presence of extracellular Ca2+, the increase in [Ca2+](i) was significantly reduced after stimulation of human platelets with high concentration of thrombin when pre-treated with MK-801 (Figures 5C,D). Reduced Ca2+ mobilization was also observed in MK-801 treated human platelets after stimulation with CRP (Figures 5E,F). However, in the absence of extracellular Ca2+ (EDTA) we did not detect any alterations in Ca2+ mobilization when platelet were activated with thrombin (Figures 5G,H) or CRP (Figures 5I,J) following MK-801 treatment. Taken together, measurements of agonist-induced changes in [Ca2+]i revealed a clear reduction of SOCE but not of store release after inhibition of the NMDAR with MK-801 in human platelets.
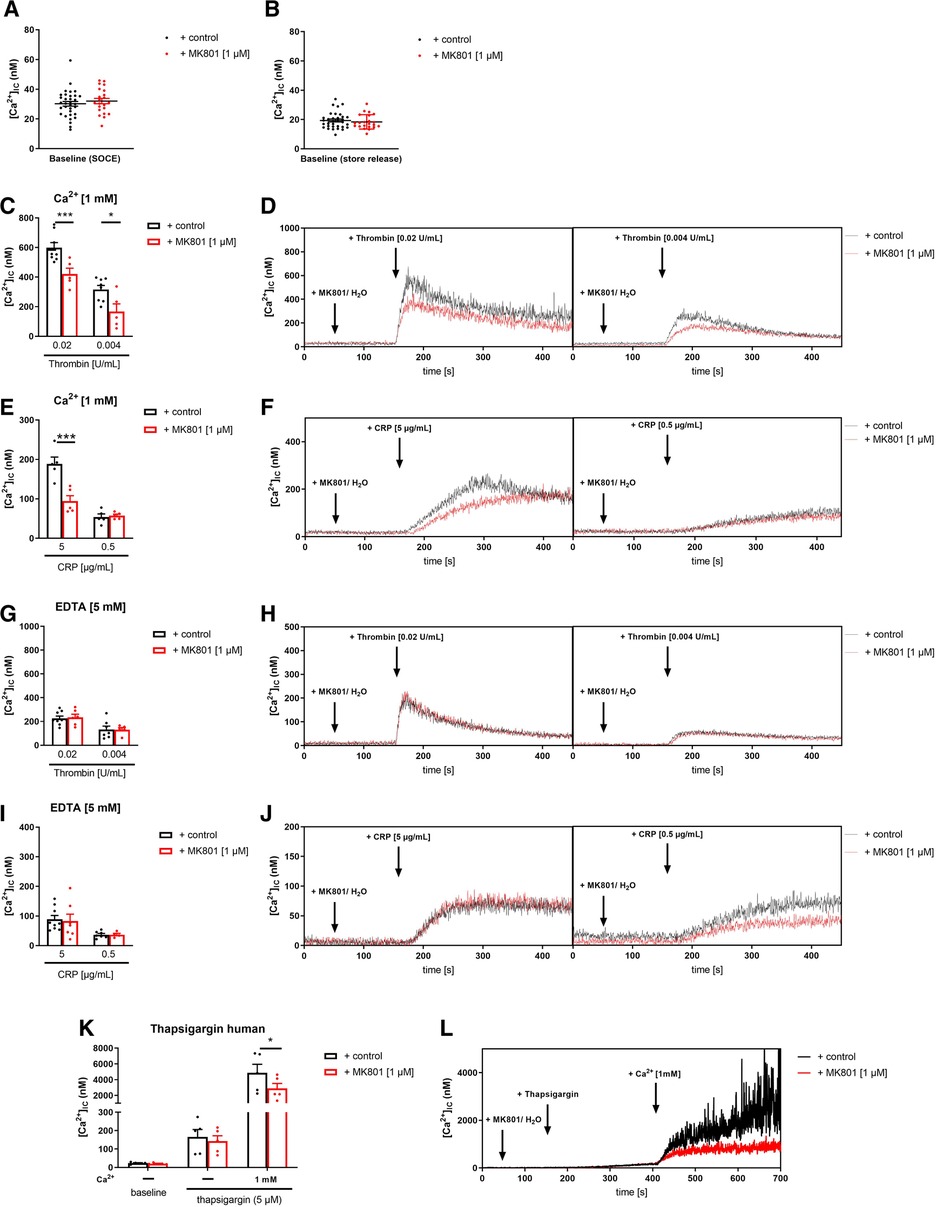
Figure 5. Inhibition of NMDAR leads to reduced store-operated-calcium-entry (SOCE) in human platelets. (A) Determination of intracellular Ca2+ concentrations [Ca2+](i) of platelets in buffer containing 1 mM Ca2+ for SOCE measurement after addition of MK-801 (n = 22–33). (B) Determination of [Ca2+](i) of platelets in buffer containing 5 mM EGTA for store-release measurement after addition of MK-801 (n = 22–33). (C) Determination of SOCE after NMDAR receptor blockade via MK-801 followed by thrombin stimulation (n = 5–8). (D) Representative measurements of [Ca2+](i) in the spectral fluorimeter after thrombin stimulation. (E) Determination of SOCE after MK-801 addition followed by stimulation with collagen-related peptide (CRP) compared to vehicle control treated platelets (n = 5). (F) Representative measurements of [Ca2+](i) in the spectral fluorimeter after CRP stimulation. (G) Determination of store release after NMDAR receptor blockade via MK-801 followed by thrombin stimulation (n = 5–8). (H) Representative measurements of [Ca2+](i) in the spectral fluorimeter after thrombin stimulation. (I) Determination of store release after MK-801 addition followed by stimulation with collagen-related peptide (CRP) compared to vehicle control treated platelets (n = 6–8). (J) Representative measurements of [Ca2+](i) in the spectral fluorimeter after CRP stimulation. (K) Determination of the [Ca2+](i) using the sarcoplasmic/endoplasmic reticulum Ca2+-ATPases (SERCA-2) inhibitor thapsigargin and the NMDAR receptor inhibitor MK-801 following Ca2+ administration (n = 5). (L) Representative measurements of intracellular Ca2+ flux in the spectral fluorimeter after SERCA-2 and NMDAR receptor inhibition via thapsigargin and MK-801. Depicted are mean values + s.e.m.; *P < 0.05, ***P < 0.001 using two-way ANOVA followed by Sidak's multiple comparison test.
3.7. Reduced ATP release and decreased activation of integrin αIIbβ3 at the surface of human platelets treated with MK-801
To evaluate the consequences of reduced SOCE on platelet function, we determined platelet activation by flow cytometry using the antibody PAC-1 to detect active integrin αIIbβ3 and using an antibody against P-selectin to determine degranulation of alpha granules. Inhibition of the NMDAR at the membrane of human platelets reduced the number of active integrin αIIbβ3 in response to ADP, CRP and PAR4 peptide at different concentrations (Figure 6A). MK-801 treatment of human platelets did not affect P-selectin exposure of platelets (degranulation of alpha granules) (Figure 6B). In line with the results from knock-out mice, we detected reduced ATP release (dense granule release) upon stimulation with indicated agonists (Figures 6C,D). Because platelet aggregation has been already analyzed in Grin1fl/fl-Pf4-Cre+ mice (28), we performed aggregation studies with human platelets and MK-801 treatment. In line with the results from GluN1 deficient knock-out mice, we did not observe any differences when platelet aggregation in response to CRP or PAR4 peptide at different concentrations were analyzed under static conditions (Figures 6E,F). However, under flow, we detected reduced formation of three-dimensional thrombi under all arterial shear rates tested when the NMDAR was blocked by MK-801 (700, 1,000, 1,700 s−1) using the well-known flow chamber (Figures 6G,H). In line with results obtained from murine platelets, we analyzed the phosphorylation of Src in human platelets after MK-801 treatment. Inhibition of the NMDAR led to reduced Src phosphorylation following platelet activation with CRP and PAR4 peptide confirming the impact of the NMDAR on Src activation in platelets (Figures 6I,J).