Transcriptional profiling of hepatocytes infected with the replicative ... - Malaria Journal
Transcriptomic analysis of primary hepatocytes infected with P. cynomolgi schizonts
To gain insight into the host response during the liver stages of malaria, previously published RNA sequencing datasets obtained from primary simian hepatocytes infected with P. cynomolgi [9, 10] were aligned to a reference host genome and used to quantify the expression of host genes in comparison to naive cells from uninfected samples (see Methods). More precisely, P. cynomolgi-infected hepatocytes were cultured for 6–10 days and subsequently FACS-purified, yielding GFP-expressing hypnozoites (GFP-low) and schizonts (GFP-high). These samples were then compared to naive uninfected cells using RNAseq. Preliminary results showed that while samples infected for 6–7 days were associated with only few statistically significant differentially expressed genes, samples infected for 9–10 days were associated with numerous statistically significant changes in comparison to uninfected samples (data not shown). As GFP-low samples were previously shown to be contaminated with uninfected cells as well as with schizont or released merozoite transcripts at 9–10 day post-infection (dpi) [10], the GFP-low samples were excluded from this study (See Additional file 2 for a descriptive list of samples used in this study) and the hepatocyte response to hypnozoites was not determined. Despite this, the 9–10 dpi GFP-high samples were further analysed to provide a snapshot of the transcriptional response of primary rhesus macaque hepatocytes to P. cynomolgi schizonts.
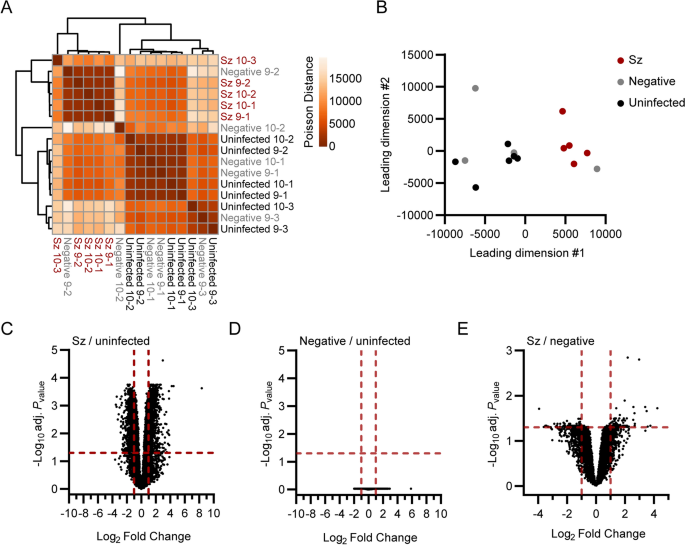
Global transcriptional differences between schizont-infected cells, uninfected bystander (GFP-negative, negative) cells and naive cells from uninfected samples were evaluated using sample-to-sample distance analyses (Fig. 1A, B). While clusters for schizont-infected cells and cells from uninfected samples were clearly separated in space, the clustering of the negative samples were not as defined. This variation might be of either technical or biological origins and might have been influenced by a heterogeneous response to salivary gland-derived material or by a heterogeneous response of bystander uninfected cells to infection. However, the GFP-negative samples tended to be distributed closer to the uninfected than the schizont-infected samples, suggesting that the transcriptional profile of schizont-infected cells was mainly a direct result of the infection. It was reasoned that while the comparison of schizont-infected cells to uninfected samples might reveal a larger number of statistically significant gene modulations, the comparison of schizont-infected cells to uninfected bystander cells was likely to be more stringent and reveal genes specifically modulated in schizont-infected hepatocytes. Therefore, the transcriptional response of schizont-infected cells was determined in comparison to both uninfected samples and uninfected bystander cells, allowing the identification of specific signatures with higher confidence.

Transcriptomic analysis of primary rhesus macaque hepatocytes infected with P. cynomolgi schizonts. Heat map (A) and multidimensional scaling (MDS) plot (B) showing sample-to-sample separation of cells infected with schizonts (Sz, in red), uninfected bystander (Negative, in grey) cells and cells from uninfected samples (Uninfected, in black). Volcano plots showing mean log2 fold changes and -log10 adjusted Pvalues (adj. Pvalue) for cells infected with schizonts in comparison to uninfected samples (C), negative cells in comparison to uninfected samples (D) and cells infected with schizonts in comparison to negative cells (E). Horizontal and vertical dotted red lines indicate adjusted Pvalues less than 0.05 [or − log10 (adj. Pvalue) greater than 1.3] and absolute log2 fold changes greater than 1, respectively
Thousands of genes were found to be significantly modulated (i.e., genes associated with absolute log2 fold change > 1 and adjusted Pvalue < 0.05) in schizont-infected hepatocytes in comparison to uninfected samples (Fig. 1C and Additional file 3). No statistically significant changes in gene expression were detected in uninfected bystander (negative) cells in comparison to uninfected samples using the Pvalues adjusted for multiple comparisons (Fig. 1D), again suggesting that the transcriptional modulations detected in schizont-infected cells are a direct response to intracellular parasites. However, it is noteworthy that transcriptional changes could be detected in uninfected bystander cells vs uninfected samples using the more permissive standard Pvalues (Additional file 4). Moreover, several of the most modulated transcripts in schizont-infected cells were also modulated, although to a lesser extent and not significantly, in negative cells in comparison to uninfected samples (Additional file 5). Relatively fewer transcripts were associated with statistically significant changes in schizont-infected vs. negative cells (Fig. 1E and Additional file 6). Interestingly, transcripts modulated in schizont-infected cells vs. uninfected samples and schizont-infected cells vs. negative cells showed some overlap for the 25 most upregulated (e.g., CXCL19, ADH7 and RGS1) and downregulated (e.g., HOXB9, RNF165 and LGALS7) genes (Additional files 5, 7). Overall, differentially expressed genes were detected in schizont-infected hepatocytes in comparison to both uninfected samples and uninfected bystander cells, but no significant modulations were detected in uninfected bystander cells in comparison to cells from uninfected samples.
Pathway analysis of differentially expressed genes in schizont-infected hepatocytes in comparison to cells from uninfected samples
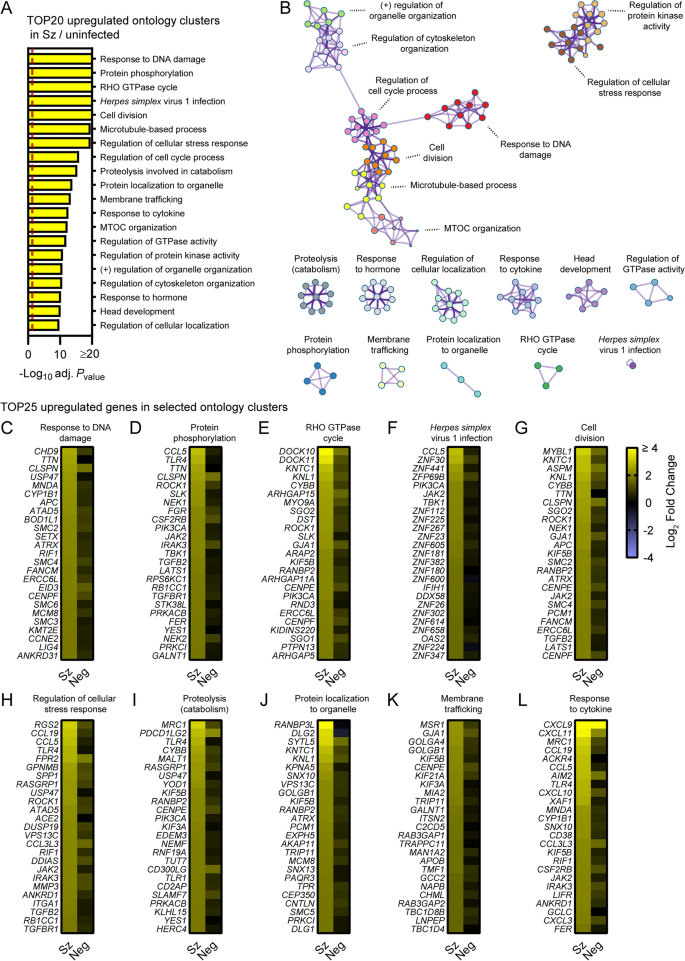
To focus on the most robustly modulated genes, filtered-by-threshold pathway enrichment analyses were performed using genes associated with statistically significant changes in schizont-infected cells versus uninfected samples (Fig. 1C and Additional file 3) and Metascape [17]. The 20 most enriched Metascape ontology clusters in genes upregulated by schizont-infected cells (Additional file 8) are represented in a histogram (Fig. 2A) and in a network layout that connects enriched terms with a certain level of similarity (Fig. 2B). Interestingly, 7 of the most significantly enriched ontology clusters were interconnected and shared genes associated with the response to DNA damage, cell division, microtubule-based process, regulation of cell cycle, microtubule-organizing center (MTOC), regulation of cytoskeleton organization and regulation of organelle organization. Two other ontology clusters were also interconnected and included genes involved in regulation of the cellular stress response and in regulation of protein kinase activity. The remaining most significantly enriched ontology clusters were discrete and related to other pathways such as RHO GTPase cycle, response to Herpes simplex virus 1 (HSV-1) infection, proteolysis involved in catabolism, membrane trafficking and response to cytokines. Ten ontology clusters were further selected and the expression levels of the 25 most up-regulated genes were visualized for each of these clusters in both schizont-infected and uninfected bystander (negative) cells in comparison to uninfected cells (Fig. 2C–L). While most groups of genes were more strongly and homogenously upregulated in schizont-infected cells, several genes were also expressed at noticeable levels in negative cells (e.g., CLSPN, PDCD1LG2 and CXCL9). The results thus suggested that schizont-infected hepatocytes upregulate multiple biological pathways in comparison to cells from uninfected samples and, in most cases but not always exclusively, in comparison to uninfected bystander cells.

Pathway analysis of genes significantly upregulated in schizont-infected hepatocytes in comparison to uninfected samples. A Most enriched ontology clusters for genes significantly upregulated in primary rhesus macaque hepatocytes infected with P. cynomolgi schizonts. The vertical dotted red line indicates adjusted Pvalues less than 0.05 (or − log10 (adj. Pvalue) greater than 1.3). The most significantly enriched term of each ontology clusters was selected as the cluster label. B Subset of representative terms were selected to generate a network of enriched ontology clusters. Terms are represented by circle nodes with colors that shows belonging to a specific cluster. Circles nodes with similarity scores > 0.3 are linked with edges. C–L Heat maps of log2 fold changes for the 25 most upregulated genes for selected ontology clusters. Data are shown for schizont-infected and uninfected bystander (negative) cells in comparison to uninfected samples. Some annotation terms are abbreviated or modified for a purpose of presentation
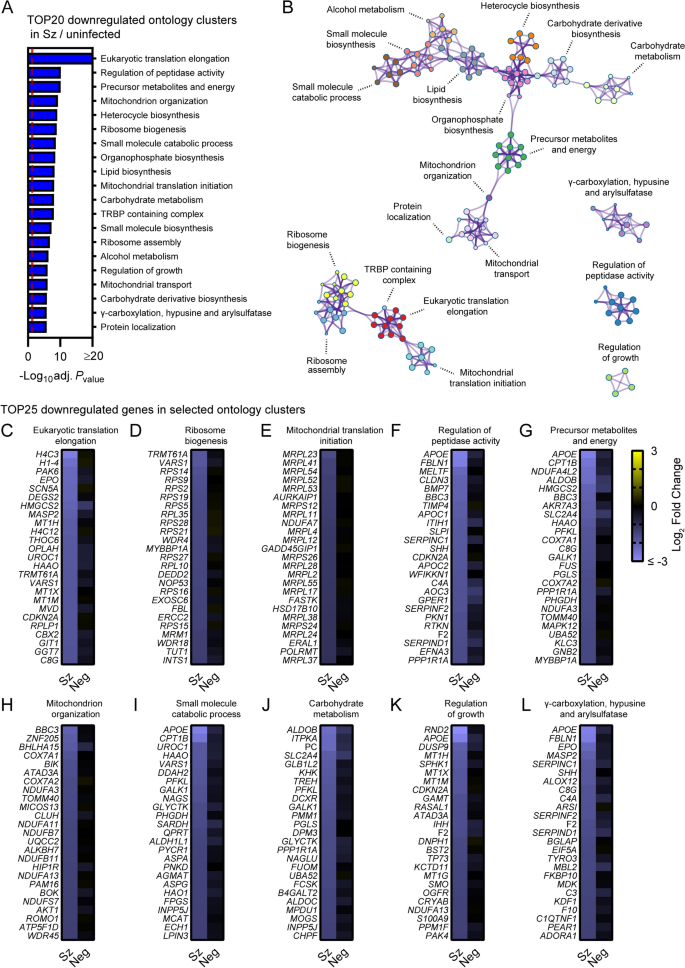
Metascape pathway analysis of genes significantly downregulated in schizont-infected cells vs. uninfected samples showed the enrichment of two networks of ontology clusters that relate to protein translation and ribosomes, and metabolic pathways and mitochondria, respectively (Fig. 3A, B, Additional file 9). Three other ontology clusters were distinct and included genes associated with γ-carboxylation, hypusine formation and arylsulfatase activation, regulation of peptidase activity and regulation of growth (Fig. 3B). Interestingly, Metascape analyses also revealed that genes associated with the specific transcriptional signature of the liver tissue (PaGenBase [22]) were significantly enriched among transcripts downregulated in schizont-infected cells (Additional file 10). Analysis of the 25 most down-regulated genes for selected ontology clusters showed robust and overall consistent gene repression in schizont-infected cells in comparison to both uninfected samples and uninfected bystander cells (Fig. 3C–L). These results suggested that schizont-infected hepatocytes significantly downregulate genes involved in multiple biological pathways, including pathways associated with protein translation and metabolic processes, as well as genes associated with the transcriptional signature of the liver tissue.

Pathway analysis of genes significantly downregulated in schizont-infected hepatocytes in comparison to uninfected samples. (A) Most enriched ontology clusters for genes significantly downregulated in primary rhesus macaque hepatocytes infected with P. cynomolgi schizonts. The vertical dotted red line indicates adjusted Pvalues less than 0.05 (or − log10 (adj. Pvalue) greater than 1.3). The most significantly enriched term of each ontology clusters was selected as the cluster label. (B) Subset of representative terms were selected to generate a network of enriched ontology clusters. Terms are represented by circle nodes with colors that shows belonging to a specific cluster. Circles nodes with similarity scores > 0.3 are linked with edges. (C–L) Heat maps of log2 fold changes for the 25 most downregulated genes of selected ontology clusters. Data are shown for schizont-infected and uninfected bystander (negative) cells in comparison to uninfected samples. Some annotation terms are abbreviated or modified for a purpose of presentation
Pathway analysis of differentially expressed genes in schizont-infected hepatocytes in comparison to uninfected bystander cells
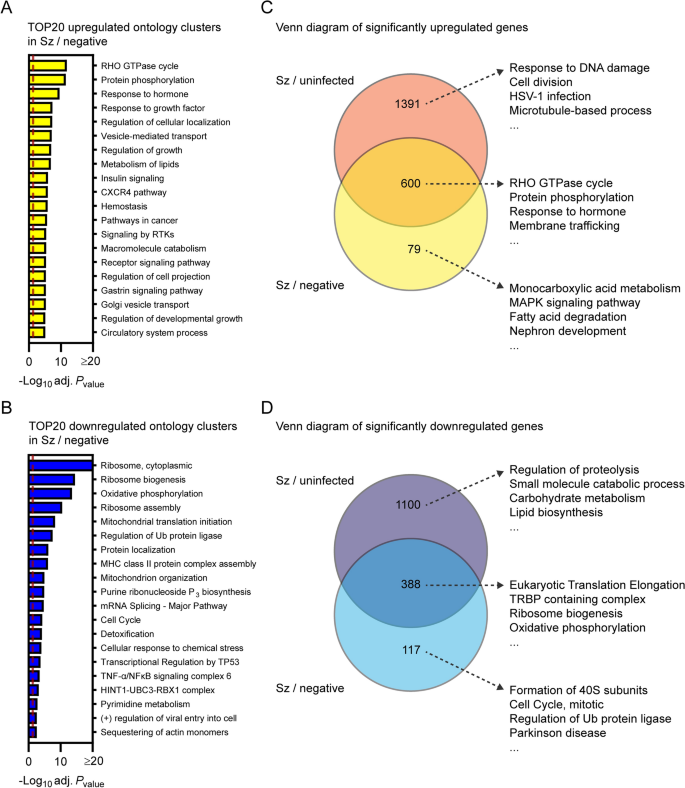
To confirm results from the previous section as well as to identify transcriptional changes strictly modulated in infected cells, Metascape pathway analysis was performed for the transcripts significantly modulated in schizont-infected vs. uninfected bystander (negative) cells. This analysis revealed enrichment of ontology clusters associated with specific biological processes in both upregulated (e.g., RHO GTPase cycle and protein phosphorylation) (Fig. 4A and Additional file 11) and downregulated (e.g., ribosome and oxidative phosphorylation) genes (Fig. 4B and Additional file 11). This analysis also confirmed the downregulation of genes associated with the liver-specific transcriptional signature in P. cynomolgi-infected hepatocytes (Additional file 12).

Transcriptional response of schizont-infected hepatocytes in comparison to uninfected bystander cells. Most enriched ontology clusters for genes significantly upregulated (A) and downregulated (B) in hepatocytes infected with schizonts in comparison to uninfected bystander (negative) cells. Venn diagram analyses comparing upregulated (C) and downregulated (D) genes in schizont-infected hepatocytes vs. uninfected samples or in schizont-infected hepatocytes vs. negative cells. The 4 most enriched ontology clusters are shown for each subgroup of genes. Dotted red lines indicate adjusted Pvalues less than 0.05 (or − log10 (adj. Pvalue) greater than 1.3). Some annotation terms are abbreviated or modified for a purpose of presentation
Venn diagram analysis was used to compare the differentially expressed genes in schizont-infected hepatocytes vs. cells from uninfected samples and in schizont-infected hepatocytes vs. negative cells, and the genes of each subgroup were then submitted to a Metascape pathway analysis (Fig. 4C, D). Genes only upregulated in schizont-infected cells vs. uninfected samples were associated with specific ontology clusters, such as response to DNA damage, cell division, HSV-1 infection, and microtubule-based process (Fig. 4C and Additional file 13) and might either represent genes that are also induced in the uninfected bystander (negative) cells or more sensitive to noise (i.e., and more impacted by the greater variability between negative samples in comparison to uninfected samples). Genes upregulated in both schizont-infected cells vs. uninfected samples and schizont-infected cells vs. negative cells were associated with other ontology clusters, such as Rho GTPase cycle, protein phosphorylation, response to hormone and membrane trafficking (Fig. 4C and Additional file 13), and represent transcripts specifically induced in infected cells. Results similarly show the specific enrichment of ontology clusters for genes only downregulated in schizont-infected vs. uninfected samples (e.g., regulation of proteolysis and small molecule catabolic process) or downregulated in both schizont-infected vs. uninfected samples and schizont-infected vs. negative cells (e.g., eukaryotic translation elongation, TRBP containing complex, ribosome biogenesis and oxidative phosphorylation) (Fig. 4D and Additional file 14). Ontology clusters enriched in genes specifically modulated by schizont-infected cells vs. negative cells were more difficult to interpret but might reflect changes induced by the infection in the uninfected bystander cell population (Fig. 4C, D). Altogether, these results showed that changes in different biological processes are detected in schizont-infected hepatocytes depending on whether the data are compared to naive cells from uninfected samples or to uninfected bystander cells.
It was hypothesized that differences in the transcriptional profiles of samples normalized to either uninfected samples or negative cells were caused by the modulation of specific transcripts, although below our threshold for statistical significance (absolute log2 fold change > 1 and adjusted Pvalue < 0.05), in the uninfected bystander (negative) cell population. Accordingly, numerous transcripts were differentially expressed in negative cells in comparison to uninfected samples once the data were filtered using a more permissive threshold (e.g., absolute log2 fold change > 1 and Pvalue < 0.05) (Additional file 4). To better understand the transcriptional changes in negative cells, data were analyzed using Gene Set Enrichment Analysis (GSEA) (Additional file 15), a threshold-free method that does not require prior filtering of genes based on statistically significant transcriptional changes [18,19,20]. Comparison of GSEA pathways enriched in schizont-infected cells and negative cells using all gene sets from the MSigDB collection showed a considerable overlap for both the upregulated and, to a lesser extent, downregulated pathways (Additional file 16). Interestingly, among selected gene sets (i.e., Gene Ontology (GO), the KEGG pathway and the Reactome pathway databases), GSEA pathways that relate to chromosome biology were significantly enriched in both schizont-infected and negative cells in comparison to uninfected samples, but not in schizont-infected vs. negative cells (Additional file 17), demonstrating a common regulation of these pathways in infected and uninfected bystander cells. Overall, these results strongly suggested that a group of specific host processes are modulated at the transcriptional level in the uninfected bystander cell population. However, whether or not these differences are of technical or biological origins is unknown. Importantly, it is possible that these differences between the naive uninfected cells and the uninfected bystander cells are influenced by both the hepatocyte response to salivary gland-derived material and the indirect response of uninfected bystander cells to malaria infection.
Host transcriptional profiling of the liver stage of Plasmodium berghei
A dual RNA sequencing study for the liver stage of the non-relapsing rodent malaria parasite P. berghei was previously published [23]. To compare the data more directly to this study, the combined host gene expression dataset for hepatocyte-like cell lines (Huh7.5.1, HC04 and HepG2) infected with P. berghei for 48 h (See Supplementary Data 5 published by LaMonte et al. [23]) was re-analysed with the filtered-by-threshold approach used in this study (i.e., absolute log2 fold change > 1 and adjusted Pvalue < 0.05) and Metascape. Similarly to P. cynomolgi-infected hepatocytes, cells infected with P. berghei upregulated genes associated with Herpes simplex virus 1 (HSV-1) infection, microtubule-based process and RHO GTPase cycle while downregulating genes associated with translation, oxidative phosphorylation and metabolic processes (Additional file 18). In addition, genes associated with the specific transcriptional signature of the liver tissue (PaGenBase database) were also significantly enriched among transcripts downregulated in P. berghei-infected cells (Additional file 19). Thus, the transcriptomes of cells infected with P. cynomolgi and P. berghei liver stage schizonts show modulation of similar biological processes.
Comments
Post a Comment