Serodiagnostic Potential of Alpha-Enolase From Sarcoptes scabiei and Its Possible Role in Host-Mite Interactions - Frontiers
Introduction
Scabies caused by the permanent ectoparasite, Sarcoptes scabiei, is a neglected and globally prevalent contagious skin disease of humans, and many domestic and wild mammals, causing significant morbidity and mortality (Bornstein et al., 2001; Engelman et al., 2013; Hay et al., 2014). S. scabiei burrows into the upper layers of the skin, feeding on epidermal cells and serum (Fischer and Walton, 2014), leading to clinical signs, such as erythematous lesions, pruritus, and burrows (Arlian, 1989; Hengge et al., 2006), as well as secondary bacterial infections (Steer et al., 2009). It was estimated in 2010 that about 100 million people were infected with scabies worldwide (Hay et al., 2014); the prevalence in different regions ranges from 0.2 to 71.4% (Romani et al., 2015). Moreover, the evidence of emerging resistance to current therapeutics, such as ivermectin (Currie et al., 2004; Mounsey et al., 2009; Terada et al., 2010), permethrin and pyrethroids (Walton et al., 2000; Mounsey et al., 2008; Andriantsoanirina et al., 2014), highlighted the necessity to identify novel targets for protective intervention (new anti-parasite therapies), which requires a deeper understanding of S. scabiei biology and the genes with vital functions.
Enolase (2-phosphoglycerate hydratase, EC 4.2.1.11) is a ubiquitous enzyme that is involved in glycolytic and gluconeogenesis pathways (Pancholi, 2001; Rodríguez et al., 2006). In addition to its basic function as a soluble cytosolic glycolytic enzyme, enolase can function as virulence factor of streptococci (Pancholi and Fischetti, 1998; Li et al., 2013), heat shock protein of mammal cells (Sirover, 1996), or proto-oncogene regulatory protein of neuroblastoma cells (Ejeskär et al., 2005) when the protein changes its cellular localization. As a widely accepted plasminogen receptors, it is also recognized for its role in pathogenesis of trypanosomatid parasites and Plasmodium (Avilan et al., 2011; Ghosh and Jacobs-Lorena, 2011; Swenerton et al., 2011). In addition, enolase may also be involved in the regulation of gene transcription; cellular differentiation and growth; and the development of several organisms, such as Giardia lamblia, Ascaris suum, Toxoplasma gondii, Naegleria fowleri, and Entamoeba invadens (Segovia-Gamboa et al., 2010; Chávez-Munguía et al., 2011; Chen et al., 2011; Castillo-Romero et al., 2012; Mouveaux et al., 2014). The important roles of enolase in the life processes of various organisms suggested its potential application as candidate vaccine (Yang et al., 2010; Chen et al., 2012; Carabarin-Lima et al., 2014; Wang et al., 2014; Dutta et al., 2015) and serodiagnostic agent (Gao et al., 2016).
In S. scabiei, enolase was reported to exist in the S. scabiei var. canis homogenate supernatant, with relative high expression (Morgan et al., 2016), and was identified as an antigenic protein (Morgan et al., 2017). Recent evidence confirmed that enolase was the target protein of an acaricide named octadecanoic acid-3, 4-tetrahydrofuran diester and that this compound interferes with the energy metabolism of S. scabiei (Song et al., 2017). But beyond that, no research has been conducted on S. scabiei enolase, despite its potential importance in S. scabiei. Therefore, the aims of this study were: (i) to clone and express S. scabiei enolase (Ssc-eno), determine its tissue distribution in isolated mites and mites in lesioned skin; (ii) to determine the immunogenicity of recombinant Ssc-eno (rSsc-eno) and evaluate its potential as a serodiagnostic antigen for sarcoptic mange in rabbits, and to use this method to monitor the antibody level of experimentally infected rabbits; and (iii) to assess the acaricidal activity of rabbit anti-rSsc-eno sera in vitro.
Materials and Methods
Ethics Statement
This study was carried out in accordance with the recommendations of the animal protection law of the People's Republic of China (a draft animal protection law released on 09/18/2009). The protocol was approved by the Care and Use of Laboratory Animals of the Animal Ethics Committee of Sichuan Agricultural University (Ya'an, China) (Approval No. 2015–028).
Parasites
The S. scabiei variety used in this study was derived from a clinically affected New Zealand White rabbit and then maintained in New Zealand White rabbits. The mites, a pool of adults, nymphs and larvae, were collected and stored in liquid nitrogen for RNA extraction.
Sera
Positive rabbit sera against S. scabiei (50 samples) were collected from naturally infected rabbits in three rabbit farms located in Sichuan Province, China, according to two gold standards including skin lesions type and observation of the mite in skin scrapings (Casais et al., 2015). Positive rabbit sera against Cysticercus pisiformis (14 samples, confirmed by autopsy) and Psoroptes ovis var. cuniculi (nine samples, confirmed by visible compatible skin lesions in the ear canal and identification of Psoroptes mites by micrography) were also collected from farms in Sichuan Province. Negative sera (48 samples) were collected from rabbits with no presence of skin lesions from two farms without a history of mange in Sichuan Province (no presence of C. pisiformis was confirmed by autopsy). Half of the negative samples were used to determine the cut-off value for all iELISAs in this study, and the other half were used to test the specificity of these iELISAs.
Expression and Purification of rSsc-eno
Total RNA was extracted from pool staged sarcoptic mites and reverse transcribed into complementary DNA (cDNA) using a RevertAid™ First Strand cDNA Synthesis Kit (Thermo Scientific, USA) according to the manufacturer's instructions. Based on the annotated S. scabiei var. cuniculi transcriptome datasets (He et al., 2017a), the full-length sequence encoding mature Ssc-eno was amplified from S. scabiei cDNA using the primers 5′-CGGATCCATGTCCATCAAAAAGATCTACGC-3′ (forward; the BamHI site is in italics) and 5′-CGAGCTCTCAAACTGGGTGGCGGA-3′ (reverse; the SacI site is in italics), and then ligated into the plasmid expression vector pET-32a(+) (Novagen, Madison, WI, USA). The recombinant protein was expressed in Escherichia coli and purified as described previously (Zheng et al., 2016). The eluted protein was concentrated and dialyzed with phosphate buffered saline (PBS) using Amicon Ultra Centrifugal Filter devices (Millipore, Billerica, MA, USA) according to the manufacturer's protocol. The purity of the eluted protein was detected by 12% sodium dodecyl sulfate-polyacrylamide gel electrophoresis (SDS-PAGE) and the concentration was measured using a BCA protein assay reagent (NJJCBIO, China).
Bioinformatic Analysis of the Ssc-eno Coding Sequence
Open Reading Frame Finder (http://www.ncbi.nlm.nih.gov/gorf/gorf.html) was used to determine the open reading frame of Ssc-eno and the deduced amino acid sequence, while SignalP 4.1 (http://www.cbs.dtu.dk/services/SignalP/) was applied to predict signal peptide. The molecular weight, isoelectric point (pI), conserved domains, and protein properties were predicted using tools on the ExPaSy web site (http://web.expasy.org/). Sequences were aligned using Clustal X software version 1.83 (Thompson et al., 1997) and the secondary structure was inferred using the YASPIN secondary structure prediction program (http://www.ibi.vu.nl/programs/yaspinwww/). Phylogenetic tree was constructed with MEGA 5·0 software (neighbor-joining method) (Tamura et al., 2011).
Antigen and Polyclonal Antibody Preparation
The rSsc-PYP-1, rSsc-lipocalin-2, rSsc-profilin [screened from transcriptome data of S. scabiei var. cuniculi (He et al., 2017a)] were all produced and purified similarly as rSsc-eno. All recombinant proteins were solubly expressed. The recombinant proteins were preserved at −80°C and later used to assess their serodiagnostic potential.
The polyclonal antibody against rSsc-eno was obtained as previously described (Zheng et al., 2016). Briefly, collecting rabbit serum before immunization and 2 weeks after the final injection, and subjecting to the indirect ELISA based on rSsc-eno. Finally, pre-immune serum and serum against rSsc-eno were purified using HiTrap Protein A affinity chromatography (Bio-Rad) and the IgG obtained was preserved at −80°C until use in Western blotting analyzes and immunohistochemical analyzes.
For the preparation of Anti-His sera, His-tagged proteins was expressed in plasmid expression vector pET-32a(+) (with no insert fragment) and purified, and then produced Anti-His sera using the above mentioned procedures. The obtained sera were used as a negative control in in vitro experiment.
Western Blotting Analyzes
The total proteins of S. scabiei from rabbits were obtained using a mammalian protein extraction kit (CWBIO, Beijing, China). Purified rSsc-eno and total mite proteins were separated by 12% SDS-PAGE and then transferred onto nitrocellulose membranes (0.22 μm). After blocking for 2 h with 5% (w/v) skim milk (in Tris-buffered saline) at room temperature, the membranes were incubated with S. scabiei-infected rabbit serum and anti-rSsc-eno rabbit IgG (1:200 v/v) respectively overnight at 4°C, while non-infected rabbit serum and IgG purified from pre-immunized rabbit serum were used as negative controls. After that, the membranes were washed and incubated with horseradish peroxidase (HRP)-conjugated goat anti-rabbit IgG (1:3,000 dilutions; Boster Bio-project Co, Wuhan, China) for 1 h at 37°C. Finally, the nitrocellulose membranes were visualized using an Enhanced HRP-DAB Chromogenic Substrate Kit (Tiangen, Beijing, China).
Preparation of Paraffin Sections and Immunohistochemical Analyzes
To prepare paraffin sections for immunohistochemical experiments, newly collected parasites and skin samples from S. scabiei-infested rabbits were used. In the present study, we developed a new method to embed isolated mites. The workflow was as follows. Firstly, the mites (20–50 mg; a pool of adults, nymphs and larvae) were fixed in 4% phosphate-buffered paraformaldehyde in a 1.5 mL Eppendorf tube for 36 h (Figure 1A). The samples were then carefully rinsed with tap water to avoid losing mites; after several washes, the samples were transferred to a 15 mL centrifuge tube and incubated in tap water overnight to clear the paraformaldehyde; the tap water was then removed as far as possible using a pipettor. Subsequently, the samples were hydrated in gradient alcohol (75, 85, 95, 100, and 100%) and made transparent using xylene (Figure 1B). The mite samples were then transferred into a 1.5 mL Eppendorf tube and 1.2 mL of melted paraffin wax was added to immerse the sample. The Eppendorf tube was placed in a Penicillin Bottle containing melted paraffin, and then placed in the drying oven at 60°C to heat the mite samples evenly (Figure 1C). It is worth noting that the mite samples sunk to the bottom of different tubes after a few minutes standing during the processes including hydrating, making transparent and soaking paraffin wax because of their relatively high density. Finally, the mite samples were transferred (using a pipettor with peeled tip preheated to 60°C) into a metal base mold containing melted paraffin wax (Figure 1D). After solidification overnight at room temperature, the paraffin wax blocks (Figure 1E) were sectioned using a rotary microtome (5 μm, Figure 1F). Skin samples were embedded using conventional methods.
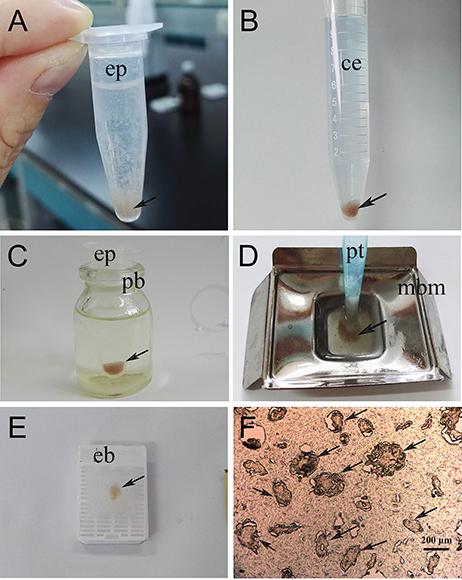
Figure 1. Flow chart of the direct paraffin wax embedding method for isolated scabies mites. (A) pooled mites fixed in 4% phosphate-buffered paraformaldehyde, the statue of mites after shaking; (B) dehydration and clearing, statue of pooled mites after treated with either gradient alcohol (75, 85, 95, 100, and 100%) or xylene and then standing for a few minutes; (C) wax immersion, the statue of pooled mites before putting into a drying oven; (D) preparation of paraffin wax blocks; (E) the resulting paraffin wax containing pooled mites after removing from its mold; (F) the resulting paraffin section (5-μm thickness) cut by using a rotary microtome and took photo under microscope. The arrows indicate mites. ep, Eppendorf tube; ce, centrifuge tube; pb, Penicillin Bottle; pt, peeled tip; mbm, metal base mold; eb, embedding box.
For immunohistochemical analyzes, procedures were performed as described previously (Zheng et al., 2016). The stained samples were mounted with glycerol/phosphate buffer (v/v, 9:1) and a coverslip, and viewed under a fluorescence microscope (Olympus, Japan).
Establishment of the rSsc-eno Indirect ELISA
ELISAs were performed essentially as described previously (Crowther and Walker, 2009; Huang et al., 2016). Briefly, the optimal concentration of antigens and serum were determined by standard checkerboard titration procedures. The ELISA plates were coated with 100 μL of six different concentration of rSsc-eno protein (serially diluted in 0.1 M carbonate buffer, pH 9.6; ranging from 4.3 to 0.27 μg/well) overnight at 4°C. After washing, the plates were blocked with 5% skim milk for 1.5 h at 37°C and then incubated with 100 μL of twofold dilutions (ranging from 1:40 to 1:1,280) of the positive and negative sera samples for 1 h at 37°C. Subsequently, the plates were incubated with 100 μL of HRP-conjugated goat anti-rabbit IgG (Boster Bio-project Co) at 37°C for 1 h. It should be noted that the plates were washed three times with PBST (0.01 M PBS +0.05% Tween-20), this washing step occurred after each incubation, and all incubations were continuously agitated. After washing, antibody binding was determined using 100 μL of tetramethylbenzidine (Tiangen) in the dark for 15 min and the OD450 value was determined in a microplate reader (Thermo Scientific, Pittsburgh, PA, USA) after the reaction was stopped with 100 μL of 2 M H2SO4. The optimal working conditions were determined when the highest P/N value were given between positive and negative serum.
Under the optimized conditions, 24 negative serum samples from naïve rabbits were used to determine the cut-off value of the iELISA, which was calculated as the mean OD450 plus three standard deviations (SD) (Jacobson, 1998). The intra- and inter-assay repeatabilities were calculated using coefficients of variation (Coefficient of variation (CV) of raw OD) of every serum sample, essentially as previous described (Sanchez et al., 2002; Casais et al., 2015).
Sensitivity and Specificity of the rSsc-eno Indirect ELISA
To further prove the feasibility of the indirect ELISA, 50 serum samples from rabbits naturally infected with S. scabiei were evaluated and the correct diagnostic rate was calculated based on the cut-off value. To evaluate the specificity of the indirect ELISA, cross-reactions were detected with C. pisiformis-positive rabbit sera and P. ovis var. cuniculi-positive rabbit sera. In addition, 24 serum samples from mange-free rabbits collected from farms without a history of mange were also tested to calculate the specificity of the indirect ELISA. Every serum sample was tested for three repeats. In summary, the sensitivity (%) of the rSsc-eno iELISA was calculated as ELISA positive × 100/true positive, and the specificity (%) was calculated as ELISA negative × 100/true negative.
Experimental Infection of Rabbits With S. scabiei and Surveillance of Anti-Ssc-eno Antibodies
Fifteen, 3-month-old scabies-free New Zealand White rabbits of 2.5–3 kg were purchased from the Laboratory Animal Center of Sichuan Agricultural University (Ya'an, China). Animals were kept under observation during an acclimatization period of 2 weeks and were confirmed to be clinically, parasitologically, and serologically free of sarcoptic mites. Ten rabbits (five females and five males) were infested with approximately 2,000 mixed life-cycle stage live mites on each previously shaved hind limb (foot area), dressed, and worn for 24 h (no dressings were removed mechanically by the animals). Another five rabbits were included as non-infested controls. Infestations were allowed to progress until 4 weeks post infection (PI), and the success of mite establishment was confirmed by the development of lesions in the foot area. Serum samples were collected once a week until the fourth week PI (i.e., before infection, 1 week PI, 2 weeks PI, 3 weeks PI, and 4 weeks PI). The anti-Ssc-eno antibodies of 75 serum samples (50 from the experimental group and 25 from the control group) were then detected using rSsc-eno based iELISA established in this study. Negative and positive controls were included in all plates.
Comparison of the rSsc-eno Based iELISA With Other Methods
For a better understanding of the utility of the rSsc-eno based iELISA, we compared it with other methods, including iELISAs based on other antigens and other published non-serodiagnostic methods.
Firstly, the optimized conditions for iELISA based on rSsc-PYP-1, rSsc-lipocalin-2, and rSsc-profilin were determined by standard checkerboard titration procedures as described for rSsc-eno based ELISA. Under the optimized condition, we determined the cut-off value for these ELISAs; then the sensitivity and specificity of these iELISAs were also determined in parallel to rSsc-eno based ELISA using the same serum samples (Table 1).
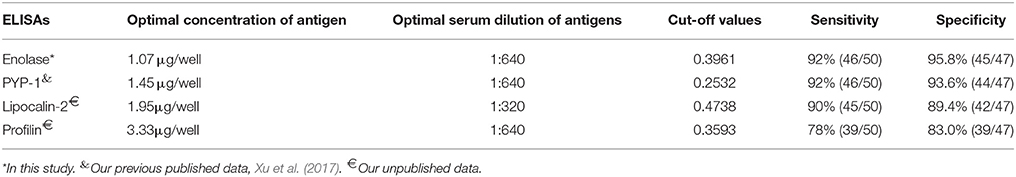
Table 1. Comparative evaluation of the serological assays for the diagnosis of sarcoptic mange in rabbits.
Additionally, parallel experiments were also performed on two groups of rabbits, including 20 rabbits with clinical signs and 10 experimentally infected rabbits (infected as described above). For both groups, skin scrapings and serum samples were collected simultaneously. In particular, for the experimentally infected group, these samples were collected before infection, 1 week PI, and 2 weeks PI, respectively. Skin scrapings were used for microscopic examination and the total DNA was extracted for a universal conventional PCR (Angelone-Alasaad et al., 2015); serum samples were subjected to the rSsc-PYP-1 based iELISA and rSsc-eno based iELISA established in this study.
In Vitro Assessment of the Acaricidal Activity of Rabbit Anti-rSsc-eno Sera Against Larval S. scabiei
To evaluate the efficacy of anti-rSsc-eno sera against larval S. scabiei, larval mites (harvested within 3 h; 10 mites for each repeat, n = 30) were incubated in decreasing concentrations of sera diluted in PBS (1:10, 1:20, and 1:40), among which, anti-rSsc-eno sera was applied as the experimental group, and anti-His sera and negative sera were applied as negative controls; PBS served as the blank control. Each experiment involved three biological replications. The method for in vitro experiment was newly developed and the detailed procedures were as follows: Step 1, round gauzes (of the same size) were prepared (with the central two fibers removed) and placed in the center of a clean Petri dish (diameter, 9.0 cm; depth, 1.5 cm) (Figure 2). Step 2, for each Petri dish, ten larvae were collected in the center of the gauze using a silver needle and then sprayed uniformly until they were completely covered by the test solutions; meanwhile, the gauze was soaked thoroughly using a pipettor to add tested solutions from outside the range of the gauze. Step 3, all plates were placed in a humidity chamber (relative humidity, 75%; temperature, 25°C) and the mites were examined under a stereomicroscope every 12 h for 72 h; the test solutions were added to the gauze to keep it wet after every observation. Death of the larvae was manifested by their immobility or the lack of reactions when gently stimulated with a needle (Macchioni et al., 2004; Seddiek et al., 2013). The incubation conditions and durations of the in vitro experiments are summarized in Table 2. Survival rates (live mites/total mites × 100%) for each experiment were calculated at every 12 h until 72 h after incubation, data represented the results derived from three replicates.
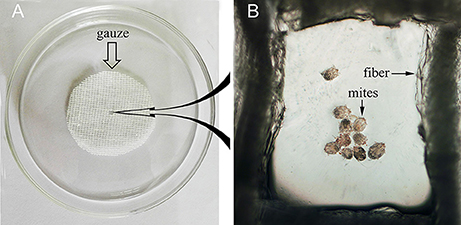
Figure 2. Schematic diagram of the in vitro incubation experiment for larval scabies mites. (A) Round shaped gauze. (B) Larval mites under the microscope (40×).
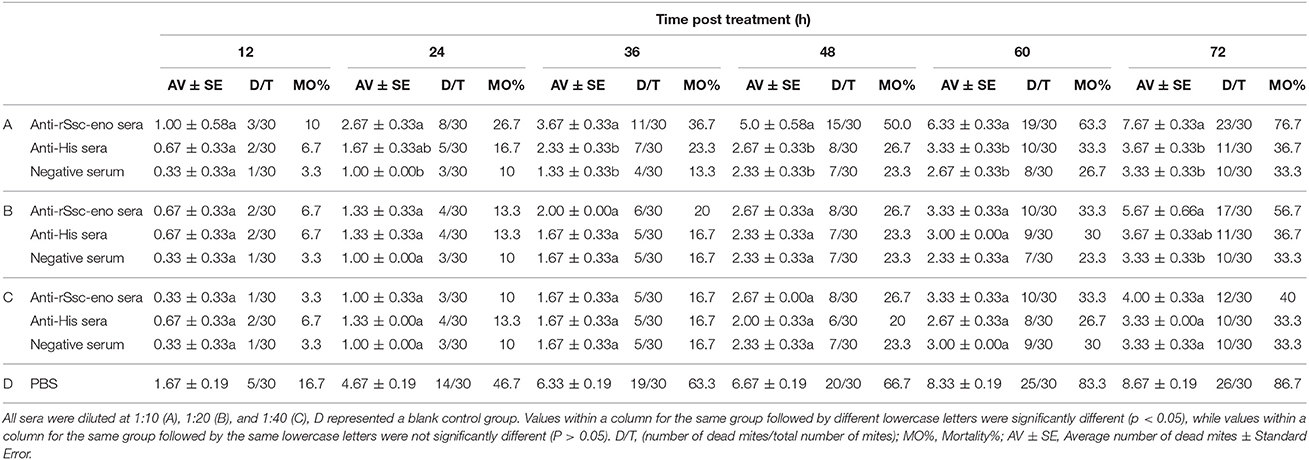
Table 2. In vitro mortality percentage of S. scabiei var. cuniculi after treatment with solutions with different concentrations of antisera.
Statistical Analysis
For the indirect ELISA, all data were presented as the mean ± standard deviation (SD). Statistical analyzes were performed using the Mann–Whitney U-test for comparison between groups in the SPSS Statistics 20 package (SPSS Inc., Chicago, IL, USA). A P-value < 0.05 was considered statistically significant. For the in vitro acaricidal assay, statistical analyzes were performed by one-way ANOVA using SPSS version 20.0 (SPSS Inc., USA); Kaplan–Meier survival curves were generated with GraphPad Prism software version 5.01.
Results
Molecular Characterization of Ssc-eno
The full length S. scabiei enolase amplified in this study contained a 1,302-bp open reading frame, encoding a mature peptide of 433 amino acid residues. The obtained sequence was exactly the same as the reported enolase from S. scabiei var. canis at both the nucleotide (QR98_0012520) and amino acid level (KPM02829.1) (Rider et al., 2015). The deduced protein had a predicted molecular weight of 47.3 kDa and pI of 5.75. No signal peptide or transmembrane regions were found. A highly conserved catalytic motif 371-[SHRSGETED]-379 and enolase signature motif 341-[LLLKVNQIGTVSES]-354 were identified by online tools, confirmed the identification of Ssc-eno (Figure 3). A multiple amino acid sequence alignment revealed that Ssc-eno had the highest identity with alpha-enolase from Dermatophagoides farinae (90%) and Euroglyphus maynei (90%, partial 404 aa), followed by 74–76% overall identity with enolases from other arthropoda, 67–73% identity with those from helminths and mammalians, 62.47% identity with an enolase from Saccharomyces cerevisiae, and less than 60% identity with enolases from protozoa.
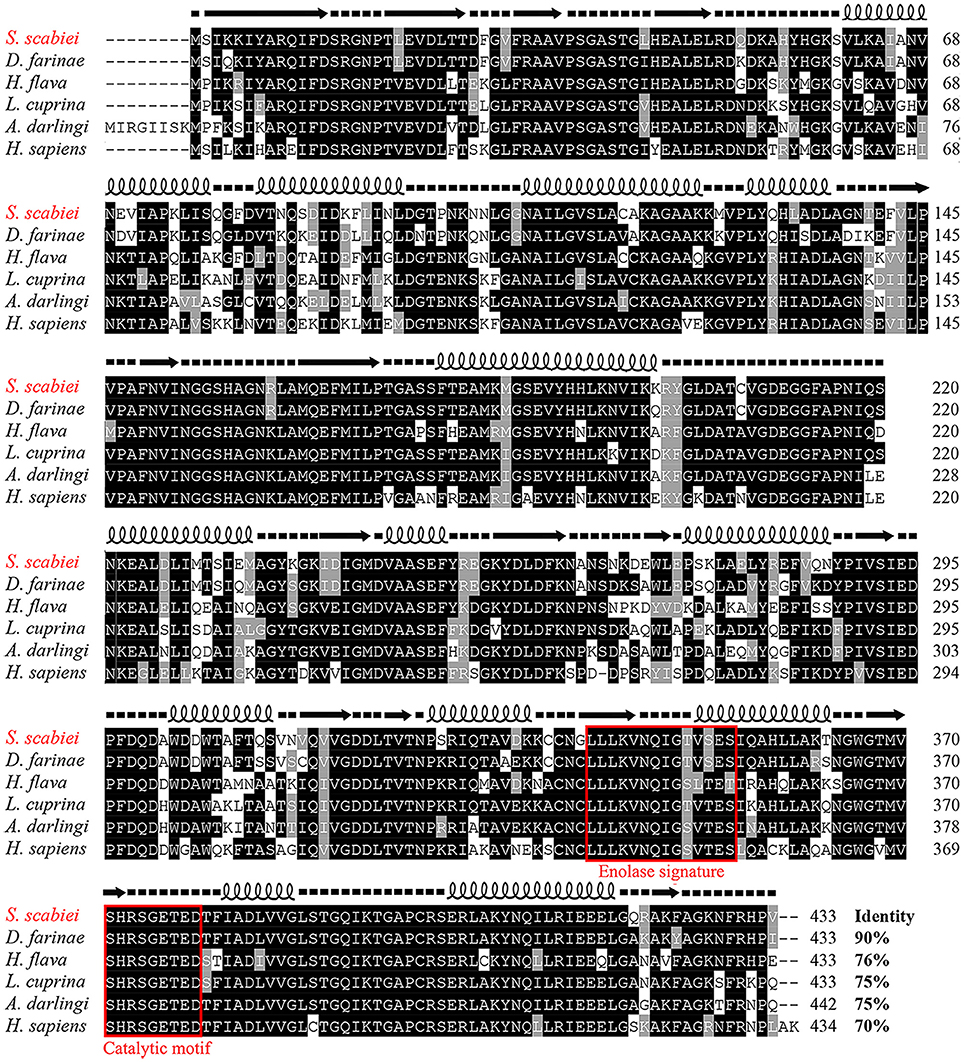
Figure 3. Sequence alignment of S. scabiei enolase (Ssc-eno). Alignments of the deduced amino acid sequence of Ssc-eno (KPM02829.1) with homologous proteins from arthropods (Dermatophagoides farinae: AHV90299.1; Lucilia cuprina: KNC30153.1; Haemaphysalis flava, AIS82610.1; Anopheles darlingi, ETN65833.1) and humans (alpha-enolase from Homo sapiens: AAY43128.1) were performed using Clustal X software version 1.83 and then shaded by BOXshade version 3.21. Predicted secondary structure elements of Ssc-eno, including coils, strands, and helices, are shown above the alignment as dashed lines, straight lines, and loops, respectively. The enolase signature motif and catalytic motif are enclosed in red boxes.
To probe the evolutionary position of Ssc-eno, the amino acid sequences of 40 enolases from numerous species representing most taxonomic groups were aligned and subjected to phylogenetic analysis (NJ tree) (Figure 4). In general, the results were in good agreement with traditional taxonomy, with Ssc-eno and other arthropoda species clustered into a group within the phylum Arthropoda, then with other eukaryotic species, and finally prokaryotic species, such as protozoa and bacteria. In particular, enolases from vertebrates were characterized by greater intraspecific, rather than interspecies, similarities, demonstrated as separate monophyletic branches for three different enolase isoforms (α, β, and γ) reflecting their different functions; this results was consistent with previous study (Piast et al., 2005).
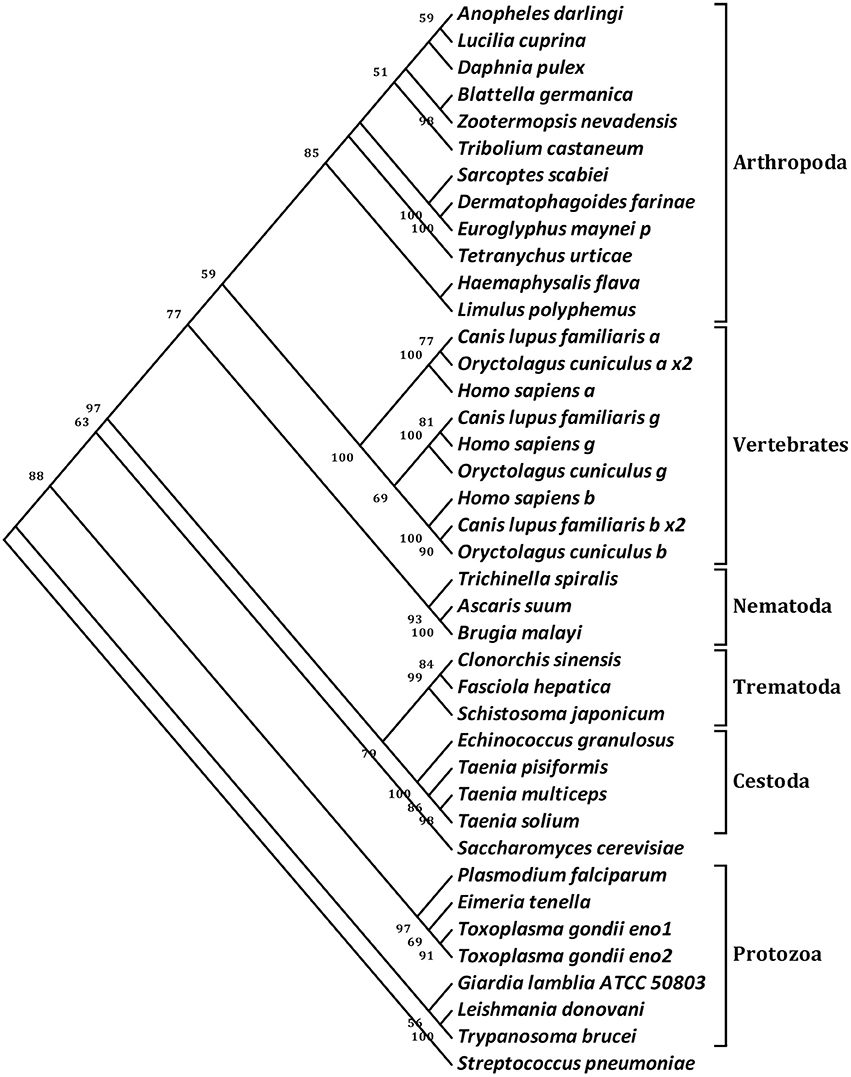
Figure 4. Phylogenetic relationships of S. scabiei enolase (Ssc-eno) with homologous enolases. The tree was constructed from a multiple sequence alignment performed using Clustal W2 and plotted using MEGA 5.10. Numbers indicate bootstrap values (>50%). The protein sequences used in the tree, with their GenBank accession numbers, are listed as follows: Anopheles darling, ETN65833.1; Lucilia cuprina, KNC30153.1; Daphnia pulex, EFX83276.1; Blattella germanica, ABC96322.1; Zootermopsis nevadensis, KDR20985.1; Tribolium castaneum, XP_975266.1; Sarcoptes scabiei, KPM02829.1; Dermatophagoides farinae, AHV90299.1; Euroglyphus maynei p, OTF73661.1; Tetranychus urticae, XP_015782335.1; Haemaphysalis flava, AIS82610.1; Limulus polyphemus, XP_013772811.1; Canis lupus familiaris a, XP_013972892.1; Oryctolagus cuniculus a x2, XP_002716189.2; Homo sapiens a, NP_001419.1; Canis lupus familiaris g, XP_003639985.1; Homo sapiens g, NP_001966.1; Oryctolagus cuniculus g, XP_002712960.1; Homo sapiens b, NP_001967.3; Canis lupus familiaris b x2, XP_005619976.1;Oryctolagus cuniculus b, NP_001075554.1; Trichinella spiralis, AAK50056.1; Ascaris suum, ERG79934.1; Brugia malayi, XP_001896281.1; Clonorchis sinensis, GAA51601.1; Fasciola hepatica, CAK47550.1; Schistosoma japonicum, ACV41761.1; Echinococcus granulosus, ACY30465.1; Taenia pisiformis, AGU16441.1; Taenia multiceps, AFJ44747.1; Taenia solium, AQQ11626.1; Saccharomyces cerevisiae, AAA88713.1; Plasmodium falciparum, AAA18634.1; Eimeria tenella, AAK38886.1; Toxoplasma gondii eno1, AAP24058.1; Toxoplasma gondii eno2, AAP24057.1; Giardia lamblia ATCC 50803, XP_001709336.1; Leishmania donovani, ACE74540.1; Trypanosoma brucei, AAF73201.1; Streptococcus pneumoniae, OBX44201.1. Notes: a (α-enolase), b (β-enolase), g (γ-enolase), x2 (isoform 2).
Expression and Identification of rSsc-eno
The Ssc-eno gene was successfully ligated to the pET32a (+) expression vector and expressed as a soluble protein in Escherichia coli BL21 (DE3) cells (Figure 5, lane 1). The purified protein had an expected size of approximately 65 kDa, including an approximately 20 kDa epitope tag fusion peptide (Figure 5, lane 2). Western blotting analysis showed that a single band (approximately 65 kDa) was recognized by rabbit anti-S. scabiei serum (Figure 5, lane 3), which suggested strong reactivity and antigenicity of rSsc-eno. Moreover, anti-rSsc-eno IgG specifically recognized an approximately 47 kDa protein from total protein extracts of S. scabiei (Figure 5, lane 5), which corresponded to the size of predicted native Ssc-eno and suggested good specificity and antigenicity. No signal was recognized by serum from naïve rabbits or IgG purified from pre-immune serum (Figure 5, lane 4 and lane 6).
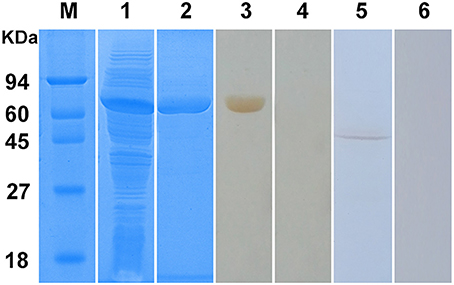
Figure 5. Sodium dodecyl sulfate-polyacrylamide gel electrophoresis (SDS-PAGE) and western blotting analysis of S. scabiei enolase (Ssc-eno). M, molecular weight markers; Lane 1, recombinant (r)Ssc-eno expressed in E. coli BL21 (DE3) after induction; Lane 2, purified rSsc-eno (6μg); Lane 3, purified rSsc-eno probed with serum from a rabbit naturally infected with S. scabiei (6μg); Lane 4, purified rSsc-eno probed with naïve rabbit serum (6μg); Lane 5, total protein from S. scabiei probed with IgG purified from the anti-rSsc-eno rabbit serum (30μg); Lane 6, total protein from S. scabiei probed with purified IgG from pre-immune rabbit serum (30μg).
Immunolocalization of Native Ssc-eno
For isolated mites, strong signals were observed on the tegument of the mouthparts, the entire legs, and the whole mites' body, as well as in the gut and reproduction system (Figures 6A,B). Interestingly, the native Ssc-eno protein was widely distributed in mites (Figure 6E) and egg during development (Figure 6F) in lesioned skin, with markedly high protein intensity compared with isolated mites. No staining was observed in mites or host tissues using IgG from pre-immune sera (Figures 6C,D).
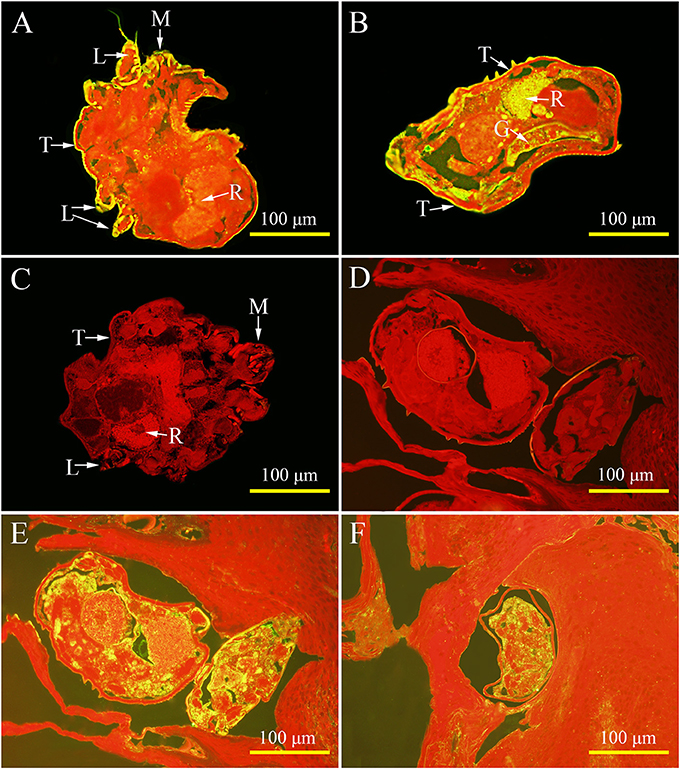
Figure 6. Immunolocalization of native S. scabiei enolase (Ssc-eno). Mites or skin samples were fixed in paraformaldehyde and embedded in paraffin. The green fluorescent color shows the location of the native Ssc-eno protein. The sections (5μm) were incubated with either rabbit anti-rSsc-eno IgG at 1:100 (A,B,E,F) or preimmune IgG at 1:100 (C,D), diluted in phosphate buffered saline (PBS). Arrows indicate: a positive signal in the tegument around the mouthparts (A); the entire legs (A); the whole mites' body (A,B); the gut (B); and the reproduction organ (A,B). No staining was observed in mites and host tissues using IgG purified from preimmune serum (C,D), confirming that the detected immunolabeling was specific. T, tegument; M, mouthparts; L, legs; G, gut; R, reproduction organ.
Establishment of the rSsc-eno Based Indirect Enzyme-Linked Immunosorbent Assay (iELISA)
According to the checkerboard titration protocol, the optimal concentration of antigens was 1.07 μg/well and the optimum serum dilution was 1:640 (Table 1). The cut-off value of the indirect ELISA was calculated as 0.396 (mean + 3SD): the mean absorbance was 0.242 and the standard deviation was 0.051. Therefore, serum samples with OD450 ≥ 0.396 were considered as positive, while OD450 < 0.396 were considered negative.
The coefficients of variation (CVs) of the intra-assay variation ranged from 0.55 to 4.69% (mean value 1.78%) and those of the inter-assay variation ranged from 0.86 to 7.73% (mean value 3.97%). All CVs were < 10%, indicating that the rSsc-eno indirect ELISA was repeatable and reliable.
Sensitivity and Specificity of the rSsc-eno Based iELISA
Forty-six out of 50 sera naturally infected with sarcoptic mites tested as positive (OD450 > 0.396) and the sensitivity of iELISA was determined as 92% (46/50) (Figure 7, left panel). Two P. ovis var. cuniculi-positive serum samples cross-reacted with Ssc-eno, thus the specificity of the rSsc-eno ELISA was calculated as 95.8% (45/47) (Figure 7, middle and right panel). Statistical significance was observed between S. scabiei-positive sera and other positive sera (including C. pisiformis-positive rabbit sera and P. ovis var. cuniculi positive rabbit sera) (Mann–Whitney U, z = −6.750, p < 0.001), as well as between S. scabiei-positive sera and healthy rabbit sera (Mann–Whitney U, z = −5.843, p < 0.001). No difference was noted between healthy rabbit serum samples and the other positive serum samples (Mann–Whitney U, z = −1.266, p = 0.205).
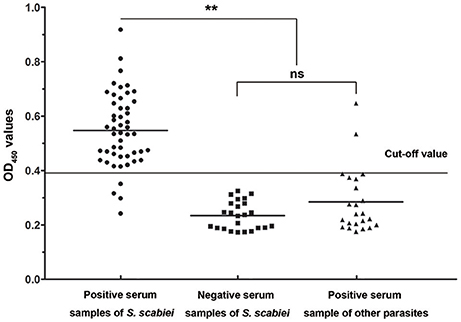
Figure 7. Sensitivity and specificity of the enzyme-linked immunosorbent assay (ELISA) for recombinant S. scabiei enolase (rSsc-eno). The horizontal line represents the cut-off value (0.396). Statistically significant differences were observed between S. scabiei-positive sera and the other positive sera, including C. pisiformis-positive sera (n = 14) and P. ovis var. cuniculi-positive sera (n = 9) (Mann-Whitney U, z = −6.750, p < 0.001), as well as between S. scabiei-positive sera and healthy rabbit sera (Mann–Whitney U, z = −5.843, p < 0.001). No difference was noted between healthy rabbit serum samples and the other positive serum samples (Mann–Whitney U, z = −1.266, p = 0.205).
Surveillance of the Anti-Ssc-eno Antibody in Rabbits Experimentally Infected With S. scabiei
During infestation, all 10 rabbits (experimental group) developed visible clinical signs at 3–7 days, with crusts starting at the site of inoculation. Figure 8 shows the changes in the anti-Ssc-eno antibody levels when rabbits were experimentally infected with S. scabiei. From 1 week PI until the end of the experiment, the experimental group was positive for serum antibodies against Ssc-eno (OD450 > 0.396). Intriguingly, the mean Ssc-eno antibody level dramatically increased at 1 week PI and then decreased in the following weeks, but still remained detectable (OD450 > 0.396). Significant differences in the anti-Ssc-eno antibody were observed between the experimental group and the control group from 1 week PI to 4 weeks PI (Mann–Whitney U, P < 0.001), while no significance was observed before infection (Mann–Whitney U, z = −0.367, p = 0.768).
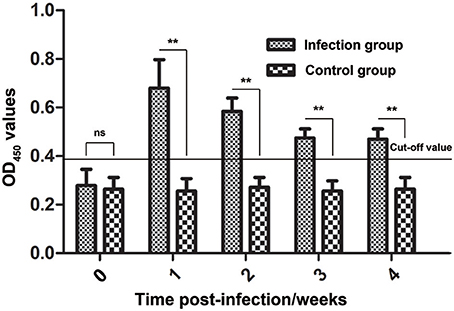
Figure 8. Serum antibody profiles of rabbits induced by S. scabiei var. cuniculi infection. The horizontal line indicates the cut-off value (0.396). Specific serum IgG antibodies were measured by an enzyme-linked immunosorbent assay (ELISA) for recombinant S. scabiei enolase (rSsc-eno) in the course of the experimental infections. Asterisks indicate statistically significant differences of anti-Ssc-eno antibody level between the infection group and the control group (**P < 0.01), and the error bars represent the standard deviation. "ns" indicates not significant.
The Results of rSsc-eno Based iELISA Compared With Other Detection Methods
The optimal concentration of antigens and serum dilution, as well as the cut-off values of other iELISAs (rSsc-PYP-1, rSsc-lipocalin-2, and rSsc-profilin iELISA) were determined (Table 1). The sensitivities of these iELISAs were 92% (46/50), 90% (45/50), and 78% (39/50) respectively, while their specificities were 93.6% (44/47), 89.4% (42/47), and 83.0% (39/47). Due to the lower sensitivity and specificity of both rSsc-lipocalin-2 and rSsc-profilin iELISA, these methods were not applied to compare with other non-serodiagnostic methods.
In addition to comparing the rSsc-eno based iELISA with other antigen-based serodiagnostic methods, we also compared it with traditional microscopic examination and a universal conventional PCR method. This is a parallel experiment with our previously study (rSsc-PYP-1 based iELISA) and the results of the other methods have been published elsewhere (Xu et al., 2017). Briefly, for 20 clinical rabbit mange cases, only one serum could not be detected using our rSsc-eno based iELISA, whereas PCR and microscopic examination could detect all of them; for 10 experimentally infected rabbits, our iELISA was positive for all of them at 1 and 2 weeks PI, while PCR was positive for 7 rabbits (at both time points) and microscopic examination was positive for two and one rabbits at 1 and 2 weeks PI, respectively.


Comments
Post a Comment